Spatial identification and tradeoff/synergy analysis of multiple agricultural land use system functions at grid scale in Henan Province
-
摘要:
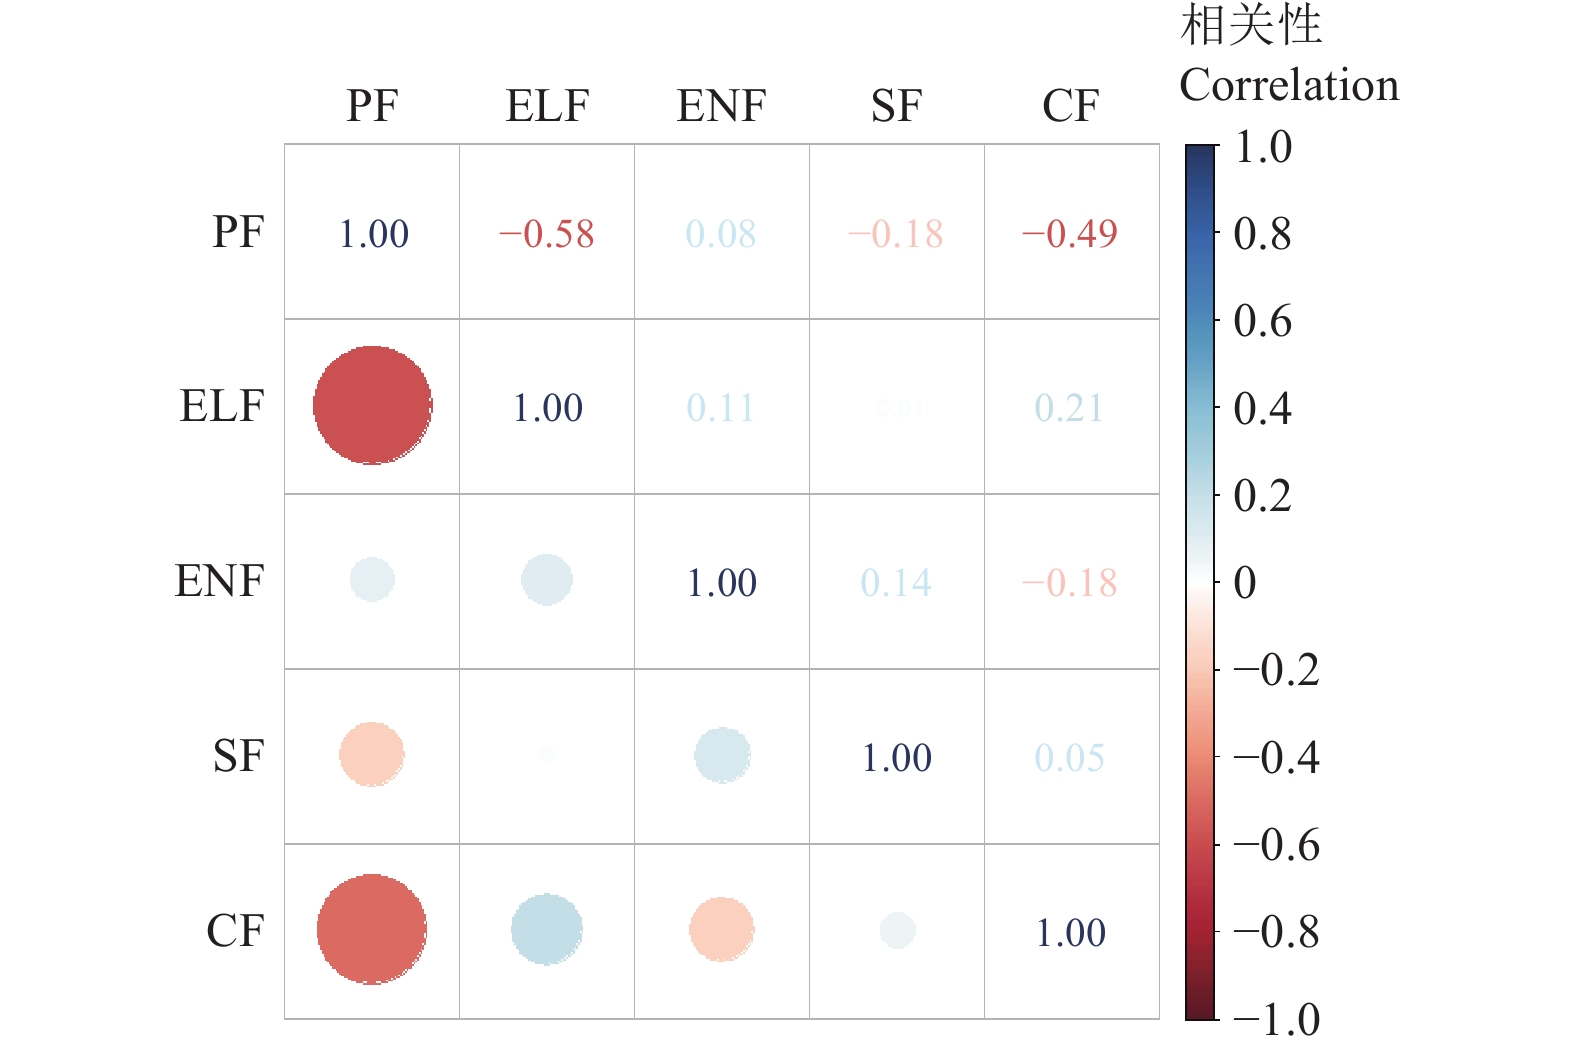
农业土地利用系统对于保障食物安全和农业可持续发展意义重大。功能的量化和分析是研究土地利用系统的有效途径。以粮食主产区河南省为研究区,1 km网格为研究尺度,融合多源数据,采用统计分析和空间分析的方法,对2020年农业土地利用系统进行功能的分类、评价、空间可视化以及相关性分析。结果表明:河南省农业土地利用系统包括了生产、生态、经济、社会和文化功能。生产功能呈现东高西低的空间格局,生态功能的整体格局与生产功能相反,经济功能总体较高且表现为东南高、中北部低的特征,社会功能均值较高且中部和西部高值明显,文化功能的均值偏低且在空间上西高东低。多功能组合中有6组为协同关系,4组主要表现为权衡关系,且生产功能和生态功能以及文化功能的权衡作用比较明显。研究结果对于了解河南省农业土地利用系统的情况以及可持续利用管理有一定的借鉴意义。
Abstract:Multifunctional land use can greatly contribute to rural life and food security in the sustainable development of agriculture. It is very necessary to clarify the agricultural land use system under the concept of the "big food view" in China. The agricultural land use system can also cover the arable, forest, grassland, and water areas. Meanwhile, the quantification and spatial analysis of land function has been one of the most effective ways to explore land use systems and sustainability. However, only a few studies have been considered to integrate the agricultural land use systems for the evaluation of their multifunctionality. Particularly, multifunctional agricultural land can often include the intentional and unintentional provision of products and services that are related to the intended land use. Although the individual function of agricultural land is not as good as that of built-up land, the comprehensive advantage of the multifunctionality of agricultural land is very prominent. Moreover, there are some tradeoffs and synergies among them, where the multifunction of agricultural land use can be interwoven with each other. The research of agricultural land multifunctionality and their relationships can promote the balanced development of multiple land use functions, which is of great significance for optimizing land spatial patterns and promoting sustainable land use. Henan Province has been one of the main grain-producing areas of China, indicating a significant contribution to the national food security. Thus, it is a suitable area to explore the agricultural land use system. Taking the Henan Province as the research area, and the 1km grid as the research scale, this study aims to classify, evaluate, visualize, and analyze the multifunction of the agricultural land use system in 2020. The statistical and spatial analysis was also performed on the multi-source data. Besides, the tradeoff/synergy relationships were determined by the quantity and space among agricultural land functions. The results showed that the agricultural land use system included the five main functions: production, ecology, economy, society, and culture. Production functions demonstrate a spatial pattern of high in the east and low in the west. The overall structure of the ecological function was opposite to that of the production function. The generally high economic function was characterized by the high in the southeast, while the low in the central and north. The mean value of social function was higher than that of the central and western regions. The low mean value of cultural functions with high in the West and low in the East. The quantitative correlation of functional functions revealed that the synergistic relationships were found in the six groups of functional combinations, whereas, four groups shared the trade-offs. There was a strong tradeoff relationship between the production and economic function, and the medium was between the production and cultural function, but there was a relatively weak tradeoff relationship between the economic and cultural function. There was also a weak synergistic effect between the production and cultural function. Furthermore, the ten groups of the five main functions showed a distinct tradeoff/synergy relationship, in terms of the spatial correlation. The production, ecological, and cultural functions presented the trade-offs in most parts of the study area, accounting for 51.58% and 52.67% of the total area, respectively. There was a synergy between ecological and cultural functions in most regions of the study area, accounting for 46.54%. 36.71% of the grid shared a trade-off between economic and cultural functions. The agricultural land use system was closely related to several sustainable goals. The findings can provide a strong reference to understanding the agricultural land use systems and their sustainable use management.
-
Keywords:
- agricultur /
- land use system /
- multifunctionality of land use /
- spatial analysis /
- correlation /
- Henan Province
-
0. 引 言
近年来,极端天气事件的频发给人类社会经济和农业生产带来了巨大损失[1–2],从气候系统各圈层相互作用机制出发寻求极端天气事件研究的突破点已成为当前科学发展的新动向[3–6]。陆面与大气相互作用是极端天气事件的主要驱动因子之一[7–10],理解其影响机制对于应对极端天气和确保粮食产量稳定具有重要意义[11]。
作为衡量陆面与大气相互作用程度的指标[12],陆气耦合强度受到陆面农业灌溉和大气环流变化的共同影响[13–16]。CHOU等[17]的研究表明,灌溉对印度夏季季风降雨的影响因地区而异,可能导致陆气耦合强度的增加或减少,主要取决于正反馈和负反馈之间的竞争影响;LU等[18]通过使用包含作物生长动态和精准灌溉的区域气候模式(WRF3.3–CLM4crop)对美国大平原地区进行分析,发现灌溉降低了美国中西部和北部大平原的耦合强度,并且这种降低与灌溉农田土壤湿度的增加高度相关。从能量角度,灌溉农田的蒸发冷却作用降低了地表温度[19]。从水量平衡角度,灌溉增加了土壤湿度和蒸散量,并通过水汽输送和大气环流的变化影响降水[20];BADGER等[21]的研究同样表明灌溉降低了亚马逊地区的陆气耦合强度。
在中国区域,陆气耦合强度的空间分布特征随耦合强度指标定义的不同而发生改变,基于土壤湿度与潜热通量耦合指标的高值区主要集中在内蒙古、甘肃、青海和新疆等中国干旱半干旱地区[22],基于感热通量与地表气温耦合指标的高值区则主要分布在河套-内蒙古地区、新疆西南部地区和长江以南部分区域[23]。现有关于中国区域的研究主要集中在大气环流对陆气耦合强度的影响方面,大规模农业灌溉对陆气耦合强度的影响尚未得到充分的论述。已有研究发现[24],更强的陆气耦合可以加剧气候变化对全球玉米产量的影响。中国的灌溉耕地约占总耕地面积的50%[25],其中粮食主产区的耕地灌溉面积占全国的近70%,2022年粮食产量达到53 718万t,占全国总产量的78.2%[26],且粮食主产区随纬度变化具有复杂多样的气候背景和土壤条件,探明灌溉对中国粮食主产区陆气耦合强度的影响机制对于保障国家粮食安全至关重要。
鉴于此,本文利用再分析数据深入评估不同灌溉占比对中国粮食主产区陆气耦合强度的影响,采用TLM(two-legged metrics)指标对中国粮食主产区的陆气耦合强度年际变化趋势、受灌溉的影响以及空间分布特征进行分析,明晰近50年灌溉扩张对粮食主产区陆气耦合强度的长期影响,以期为未来农业生产应对气候变化提供参考。
1. 资料和方法
1.1 研究区域概况
中国粮食主产区包括中国北方7省、南方6省,自北向南跨越多个气候类型,以800 mm等降水量线为界,北方省份粮食主产区(辽宁、河北、山东、吉林、内蒙古、河南、黑龙江)主要位于温带季风气候带,其显著特征为四季分明、夏季高温多雨,冬季寒冷干燥,年降水量相对较低;南方省份粮食主产区(江西、湖南、四川、湖北、江苏、安徽)处于亚热带季风气候区,夏季高温多雨、冬季温和少雨。
1.2 数据与方法
1.2.1 气象数据
土壤湿度和地表潜热通量数据来源于欧洲中期天气预报中心(ECMWF)的ERA5-Land数据集(https://cds.climate.copernicus.eu/datasets/reanalysis-era5-land?tab=overview),已有学者利用原位观测数据对ERA5-Land数据集中土壤湿度与潜热通量的精度进行了评估和验证[27-28],结果表明其适用于中国区域的长时间序列分析研究。该数据集的空间分辨率为0.1°×0.1°,满足以中国粮食主产区为研究区域的尺度需要,时间分辨率为小时数据,选取的时间段为1970—2015年。
1.2.2 灌溉面积数据
灌溉面积数据(area equipped for irrigation, AEI)来源于MEHTA等[29]构建的历史数据集(https://zenodo.org/records/
7809342 )。该数据集的空间分辨率为0.0833 °,其中1900—1980年的数据以10 a为间隔,1981—2015年的数据以5 a为间隔,本研究通过线性插值方法将1970—2015年的灌溉面积数据处理为年数据进行统计分析,为了验证灌溉面积数据的可靠性,本文将经过统计汇总后的灌溉面积数据与《中国农业统计资料1949—2019》[30]中全国历年有效灌溉数据进行了对比,2套数据的变化趋势和幅度较为吻合(图1),平均相对误差为9.9%。因此可用于中国区域灌溉面积变化对陆气耦合强度影响的分析。图2展示了南方和北方中国粮食主产区1978—2015年的灌溉面积变化,从图上可以看出1978—2015年南方和北方中国粮食主产区灌溉面积均呈现扩张趋势,且北方粮食主产区扩张速度高于南方。![]() 图 1 本研究使用数据与统计年鉴数据对比Figure 1. Comparison between data in this study and statistical yearbook data
图 1 本研究使用数据与统计年鉴数据对比Figure 1. Comparison between data in this study and statistical yearbook data![]() 图 2 粮食主产区南北方有效灌溉面积历年变化Figure 2. Annual change of effective irrigated area in the grain production areas of north and south of China
图 2 粮食主产区南北方有效灌溉面积历年变化Figure 2. Annual change of effective irrigated area in the grain production areas of north and south of China1.3 方 法
1.3.1 陆气耦合强度指标
选取GUO等[31]于2006年提出的TLMC公式来衡量陆气耦合强度的变化,公式考虑了土壤湿度和潜热通量的变化,可直观反映灌溉对陆气耦合强度的影响,计算式如下:
ICSI=∂Llh∂Ssmσ(Ssm)=COV(Ssm,Llh)σ(Ssm) 式中ICSI为陆气耦合强度指数,Ssm为土壤湿度,m3/m3,Llh为地表潜热通量,MJ/m2,Ssm与Llh进行了去趋势处理,∂Llh表示地表潜热通量的变化,∂Ssm为土壤湿度的变化,σ(Ssm)为土壤湿度的标准差,COV(Ssm,Llh)为土壤湿度与地表潜热通量的协方差。灌溉主要通过增加土壤湿度来提升下垫面潜热通量以实现其冷温效应, ICSI恰能反映两者变化协同性。当 ICSI为正值,表示此时段内区域下垫面处于土壤水分亏缺状态,土壤湿度变化对潜热通量有一定影响,即灌溉具有一定的冷温效应;当 ICSI为负值,表示当地土壤湿度足够大,且其变化并不会影响局地气候。 ICSI的物理意义是土壤湿度每变化一个标准差时潜热通量的响应值[32],表征了土壤湿度变化对潜热通量的影响。
1.3.2 密集灌溉区域与参考灌溉区域划分
采用AEI数据计算出历年每个格点的灌溉面积占比,将灌溉面积占比(current irrigated fraction, CIF)划分为多个区间,通过统计不同CIF区间的陆气耦合强度变化的差异,选择陆气耦合强度差异最明显的阙值作为密集灌溉区域和参考灌溉区域。
1.3.3 灌溉影响评估方法
BONFILS等[33]提出一种用来检测灌溉对温度的影响的方法,该方法的核心是构建密集灌溉区域和参考灌溉区域的温度时间序列变化,两者的差异为灌溉的影响。本研究采用相同的方法,即密集灌溉区域和参考灌溉区域陆气耦合强度变化趋势的差异主要由灌溉活动导致,计算式如下:
ΔICSI=ICSIirr−ICSIirrref 式中ΔICSI为密集灌溉区和参考灌溉区陆气耦合强度差值,下标irr表示密集灌溉区,irrref表示参考灌溉区。
1.3.4 突变点检验
突变分析旨在检验时间序列中是否存在显著的突变点。Pettitt检验、Buishand检验和SNHT检验是农业气象领域常用的突变检验法,3种突变检验方法的公式及统计检验的临界值详见ILORI等[34]的文献。
2. 结果与分析
2.1 密集灌溉与参考灌溉区域划分结果
根据密集灌溉区域与参考灌溉区域划分方法,将灌溉面积占比划分为(0, 0.1)、(0.2, 1)、(0.5, 1)3个区间。图3为1970—2015年全国粮食主产区CSI变化的时间序列。CIF>0.2和0<CIF<0.1的时间序列变化相接近,CIF>0.5与0<CIF<0.1之间的差异要明显大于CIF>0.2和0<CIF<0.1的差异,经过计算对比CIF>0.5(CIF>0.2)的区域均值在46 a的序列中有40(23)a大于0<CIF<0.1的区域,CIF>0.5的区域有43 a大于CIF>0.2的区域,CIF>0.5与CIF>0.2和0<CIF<0.1的历年差值均值分别为
0.0018 和0.0019 MJ/m2。由此可以看出灌溉占比越大CSI越大,灌溉占比差距越大,CSI差距越大。这一结果表明灌溉对CSI的变化有影响,大规模灌溉扩张可能改变了区域的气候条件。因此本文采用CIF>0.5的区域作为密集灌溉区,记作irr;0<CIF<0.1的区域作为参考灌溉区,记作irrref。图4展示了2015年灌溉农田区和参考灌溉区的划分图,可以看出密集灌溉区主要集中在三江平原、松嫩平原、华北平原、河套平原,长江中下游等地。![]() 图 3 不同灌溉占比陆气耦合强度对比图注:CIF为灌溉面积占比。Figure 3. The difference of coupling strength index (CSI) in different CIFNote: CIF means current irrigated fraction.
图 3 不同灌溉占比陆气耦合强度对比图注:CIF为灌溉面积占比。Figure 3. The difference of coupling strength index (CSI) in different CIFNote: CIF means current irrigated fraction.![]() 图 4 2015年密集灌溉与参考灌溉区域划分Figure 4. Division of intensive irrigation and reference irrigation area in 2015
图 4 2015年密集灌溉与参考灌溉区域划分Figure 4. Division of intensive irrigation and reference irrigation area in 2015根据Pettitt检验、Buishand检验和SNHT检验结果,均显示CSI在1996年发生突变(图3),因此,本研究以1996年为转折点对南方和北方粮食主产区CSI转折前后趋势进行分析。
2.2 灌溉对南北方陆气耦合强度变化的影响
图5为1970—2015年南、北方粮食主产区密集灌溉区和参考灌溉区CSI变化,由图5可以看出南北方CSI存在差异,北方历年CSI值处于−0.008~0.009 MJ/m2之间,南方处于−
0.019 ~−0.007 MJ/m2之间。北方历年CSI要强于南方,北方CSI在正值和负值都有分布,而南方CSI则全部处于负值区域。这主要是由于北方地区多为“土壤湿度限制型”,土壤湿度影响蒸散发,土壤湿度增大,蒸发增大;南方地区为“辐射限制型”,蒸散发主要受能量限制,土壤湿度增大,蒸散发不再增大,此时蒸散发反过来影响土壤湿度[22]。![]() 图 5 1970—2015年南北方密集灌溉与参考灌溉区域CSI变化趋势Figure 5. Trend in the change in CSI between intensive irrigation areas and reference irrigation areas in the north and south from 1970 to 2015
图 5 1970—2015年南北方密集灌溉与参考灌溉区域CSI变化趋势Figure 5. Trend in the change in CSI between intensive irrigation areas and reference irrigation areas in the north and south from 1970 to 2015由图5可以看出,密集灌溉区(CIF>0.5)与参考灌溉区(0<CIF<0.1)CSI存在明显差异。对于北方粮食主产区,密集灌溉区CSI大于参考灌溉区CSI,说明大规模灌溉增强了北方的CSI。南方地区多数年份的密集灌区CSI低于参考灌区CSI,且南方地区CSI大多数年份为负值,说明陆面对大气影响作用不明显,1996年后密集灌区CSI增速远高于参考灌区CSI降低速度,所以1996年后灌溉同样增强了南方CSI,这是因为1996年前后是东亚气候显著的转折点,东部季风雨带的向北移动,导致长江流域降水偏少而长江以北地区降水增多,南方土壤湿度降低,由“辐射限制型”向“土壤湿度限制型”转换[35]。
对于密集灌溉区,1970—1995年南方和北方粮食主产区CSI分别以−0.85×10⁻⁴和−1.63×10⁻⁴ MJ/m2的速度逐年降低,而1996—2015年分别以3.11×10−4和2.50×10−4 MJ/m2的速度增加。在参考灌溉区,北方CSI在1996年转折点前后均为上升趋势,转折后CSI上升速度由0.39×10−4 MJ/m2增加到2.11×10−4 MJ/m2,南方地区CSI则在转折前后均为降低趋势,转折后CSI降低速度由−0.38×10−4 MJ/m2降低到−0.03×10−4 MJ/m2。根据1.3.3提出的影响评估方法,计算了1970—2015年密集灌溉区与参考灌溉区CSI的差异(△CSI),结果如图6所示,△CSI的下降趋势意味着灌溉对陆气耦合的增强作用的降低,上升趋势表示灌溉对陆气耦合的增强作用的提高。
![]() 图 6 1970—2015年北方和南方密集灌溉与参考灌溉区CSI差值变化Figure 6. Change in the difference in CSI (△CSI) between intensive irrigation areas and reference irrigation areas in the north and south from 1970 to 2015
图 6 1970—2015年北方和南方密集灌溉与参考灌溉区CSI差值变化Figure 6. Change in the difference in CSI (△CSI) between intensive irrigation areas and reference irrigation areas in the north and south from 1970 to 2015对于北方和南方,△CSI在1970—1995年分别以−1.24×10⁻⁴和−1.25×10⁻⁴ MJ/m2的速率降低,在1996—2015年△CSI则分别以0.99×10−4和2.53×10−4 MJ/m2的速率上升,这表明近年来灌溉对中国粮食主产区CSI的增强作用有所提高,而1996年后南北方△CSI的主要差异是因为南方参考灌溉区1996—2015年CSI为下降趋势,北方为上升趋势,二者相反的变化趋势导致1996年后南方△CSI趋势大于北方。
2.3 灌溉影响南北方陆气耦合强度变化的机制分析
CSI主要受土壤湿度和潜热通量的协同影响,南北粮食主产区土壤湿度和潜热通量的空间分布和历年趋势如图7和图8所示。
![]() 图 7 1970—1995和1996—2015年中国粮食主产区耦合强度、土壤湿度、潜热通量与降水量空间分布注:黑点为CIF>0.5区域;SM为土壤湿度;PR为降水;LH为潜热通量;CSI为耦合强度;差值指1996—2015年与1970—1995年均值的差值。Figure 7. Spatial distribution of coupling strength, soil moisture, latent heat flux, and precipitation in China's major grain-producing areas during the periods 1970-1995 and 1996-2015Note: Black dots indicate areas where the CIF>0.5; SM is soil moisture; PR is precipitation; LH is latent heat flux; CSI is the coupling strength index; DF is the difference between the 1996-2015 and 1970-1995 averages.
图 7 1970—1995和1996—2015年中国粮食主产区耦合强度、土壤湿度、潜热通量与降水量空间分布注:黑点为CIF>0.5区域;SM为土壤湿度;PR为降水;LH为潜热通量;CSI为耦合强度;差值指1996—2015年与1970—1995年均值的差值。Figure 7. Spatial distribution of coupling strength, soil moisture, latent heat flux, and precipitation in China's major grain-producing areas during the periods 1970-1995 and 1996-2015Note: Black dots indicate areas where the CIF>0.5; SM is soil moisture; PR is precipitation; LH is latent heat flux; CSI is the coupling strength index; DF is the difference between the 1996-2015 and 1970-1995 averages.![]() 图 8 1970—2015年北方、南方密集灌溉与参考灌溉区域土壤湿度与潜热通量变化趋势Figure 8. Trend in soil moisture and latent heat flux changes between intensive irrigation areas and reference irrigation areas in the north and south from 1970 to 2015
图 8 1970—2015年北方、南方密集灌溉与参考灌溉区域土壤湿度与潜热通量变化趋势Figure 8. Trend in soil moisture and latent heat flux changes between intensive irrigation areas and reference irrigation areas in the north and south from 1970 to 2015图7为CSI、SM、LH和降水量的空间分布,黑点表示密集灌溉区。1996—2015年内蒙古东北部相比1970—1995年变化幅度较大,导致北方参考灌溉区△CSI增大(图7a和图7b),而南方参考灌溉区△CSI与北方相比变化较小(图7i)。北方和南方粮食主产区土壤湿度、潜热通量的历年变化趋势如图8所示,可以看出,北方密集灌溉区和参考灌溉区土壤湿度和潜热通量在1996年后都呈现为明显的下降趋势,而南方粮食主产区在1996年后密集灌溉区土壤湿度为上升趋势,密集灌溉区潜热通量为下降趋势;参考灌溉区土壤湿度为下降趋势,参考灌溉区潜热通量为上升趋势,土壤湿度和潜热通量的相反趋势变化导致南方密集灌区和参考灌溉区的△CSI变大(图7i)。从图8b也可以看出,南方密集灌区和参考灌溉区的土壤湿度整体降低,与前文提到的长江流域降水偏少相符合。
北方和南方密集灌溉区土壤湿度小于参考灌溉区土壤湿度(图8a,图8b),这是因为北方密集灌区主要位于华北平原和河套平原,由图7c、图7d可以看出,华北平原密集灌溉区土壤湿度处于0.20~0.25 m3/m3、河套平原地区密集灌溉区土壤湿度处于0.15~0.20 m3/m3,均低于参考灌溉区土壤湿度的0.25~0.45 m3/m3。南方密集灌区主要位于长江中下游平原,此地区密集灌溉区土壤湿度处于0.25~0.30 m3/m3要低于更南方的参考灌溉区土壤湿度的0.30~0.45 m3/m3。
北方密集灌区潜热通量在1996年以前高于参考灌溉区潜热通量,但是在1996年以后迅速降低且低于参考灌溉区潜热通量(图7k),由图7e和图7f的空间分布可以看出此变化。华北平原1970—1995年密集灌溉区潜热通量处于30~40 MJ/m2的黄色区域,而1996—2015年则处于20~30 MJ/m2的浅蓝色区域,自1996年后密集灌溉区潜热通量降低明显。1996年转折后由图7k可以看出大部分区域潜热通量降低了0~6 MJ/m2,最高降幅约15%。1996年后,华北平原密集灌溉区潜热通量由1996年以前的黄色高值区域转为蓝色低值区域,导致1996年后北方密集灌溉区潜热通量小于参考灌溉区潜热通量。
由图7k可以看出,南方地区自1996年转折后密集灌溉区潜热通量有增有减,约0~3 MJ/m2,而参考灌溉区潜热通量则增加明显,整体在0~4 MJ/m2。1970—1995年密集灌溉区潜热通量呈递增趋势,参考灌溉区潜热通量为递减趋势,1996年转折后,趋势则完全相反,密集灌溉区潜热通量逐年递减,参考灌溉区潜热通量逐年增大(图8d),在转折后的这种趋势下参考灌溉区潜热通量会超过密集灌溉区潜热通量(图7f)。1970—1995年密集灌溉区潜热通量和参考灌溉区潜热通量多处于40~50 MJ/m2,仅东南部小部分地区处于50~60 MJ/m2,而1996—2015年参考灌溉区潜热通量处于50~60 MJ/m2的区域明显增多,密集灌溉区潜热通量则依旧多处于40~50 MJ/m2。
由图7和图8可以看出,1996年转折后中国南北方的土壤湿度普遍降低,降水的空间变化趋势与土壤湿度变化相一致,表明中国南方和北方地区普遍正在变得更加干旱,这与马柱国等[36]的研究结果相符。在北方地区蒸发主要受土壤湿度控制,当土壤湿度增加(减少)时,蒸散发增加(减少),两者变化一致导致CSI值高,由图8a、图8c可以看出北方地区整体符合这种“土壤湿度限制型”的反馈机制,由图7j、图7k可以看出处于湿润和半湿润地区的东北地区,出现了土壤湿度减少,蒸散发增加的现象,表现出“能量限制型”,由于当地土壤湿度足够充分,导致实际蒸散发量接近潜在蒸散发量,当地表接受更多地净辐射时,蒸散发增加,土壤湿度减少。同样的南方地区蒸散发与土壤湿度的变化趋势并不趋同,也是典型的“能量限制型”[37]。
3. 讨 论
本文研究结果表明1996年前后东亚气候发生了显著转折,导致降水和土壤湿度的变化趋势发生了转折,使得南方粮食主产区土壤湿度降低,由“辐射限制型”向“土壤湿度限制型”转换,导致灌溉对南方粮食主产区CSI的增强作用有所提高。LIU等[38]同样发现了华北平原灌溉的降温效应在1995年后发生突变,灌溉的降温效应减弱,并将此结果归因于自20世纪90年代以来节水灌溉的发展导致灌溉水量的下降从而改变地表能量平衡使得降温效应减弱。20世纪90年代以前,节水灌溉水平不高,此时的灌溉方式多为畦灌,随着灌溉面积增大单位面积灌溉水量也在不断上升[39]。这种灌溉方式灌溉用水量较大,大幅增加了土壤含水量,有效降低了农田温度,所以随着灌溉面积的增加农田整体降温效应有所增强。随着20世纪90年代节水灌溉大面积普及,单位面积灌溉水量不断降低,灌溉降温效应减弱。这里需要指出的是本文在探讨灌溉对CSI的影响时只考虑了灌溉面积扩张的影响,从图2中可以看出南北粮食主产区灌溉面积均显扩张趋势,在20世纪90年代末并未出现明显的停滞,节水灌溉的作用并不显著,在土壤湿度的降低趋势中,气候转折和节水灌溉的占比仍需进一步研究。
4. 结 论
本文分析了1970—2015年灌溉对粮食主产区陆气耦合强度的影响,结果表明:
1)中国粮食主产区陆气耦合强度(coupling strength index,CSI)受到大规模灌溉的影响,密集灌溉区的CSI显著大于参考灌溉区,灌溉增强了CSI,且近年来这种增强效应正在逐渐变大,使得中国向更加干旱的趋势发展。
2)总体上北方粮食主产区CSI强于南方粮食主产区,1996年后,北方和南方密集灌溉区CSI变化趋势相同,但北方参考灌溉区CSI变化趋势高于南方,导致北方密集灌溉区与参考灌溉区陆气耦合强度的差值降低,南方显著升高。
3)1996年前后东亚气候发生了显著转折,导致降水和土壤湿度的变化趋势发生了转折,使得南方粮食主产区土壤湿度降低,由“辐射限制型”向“土壤湿度限制型”转换,导致灌溉对南方粮食主产区CSI的增强作用有所提高。
-
![]()
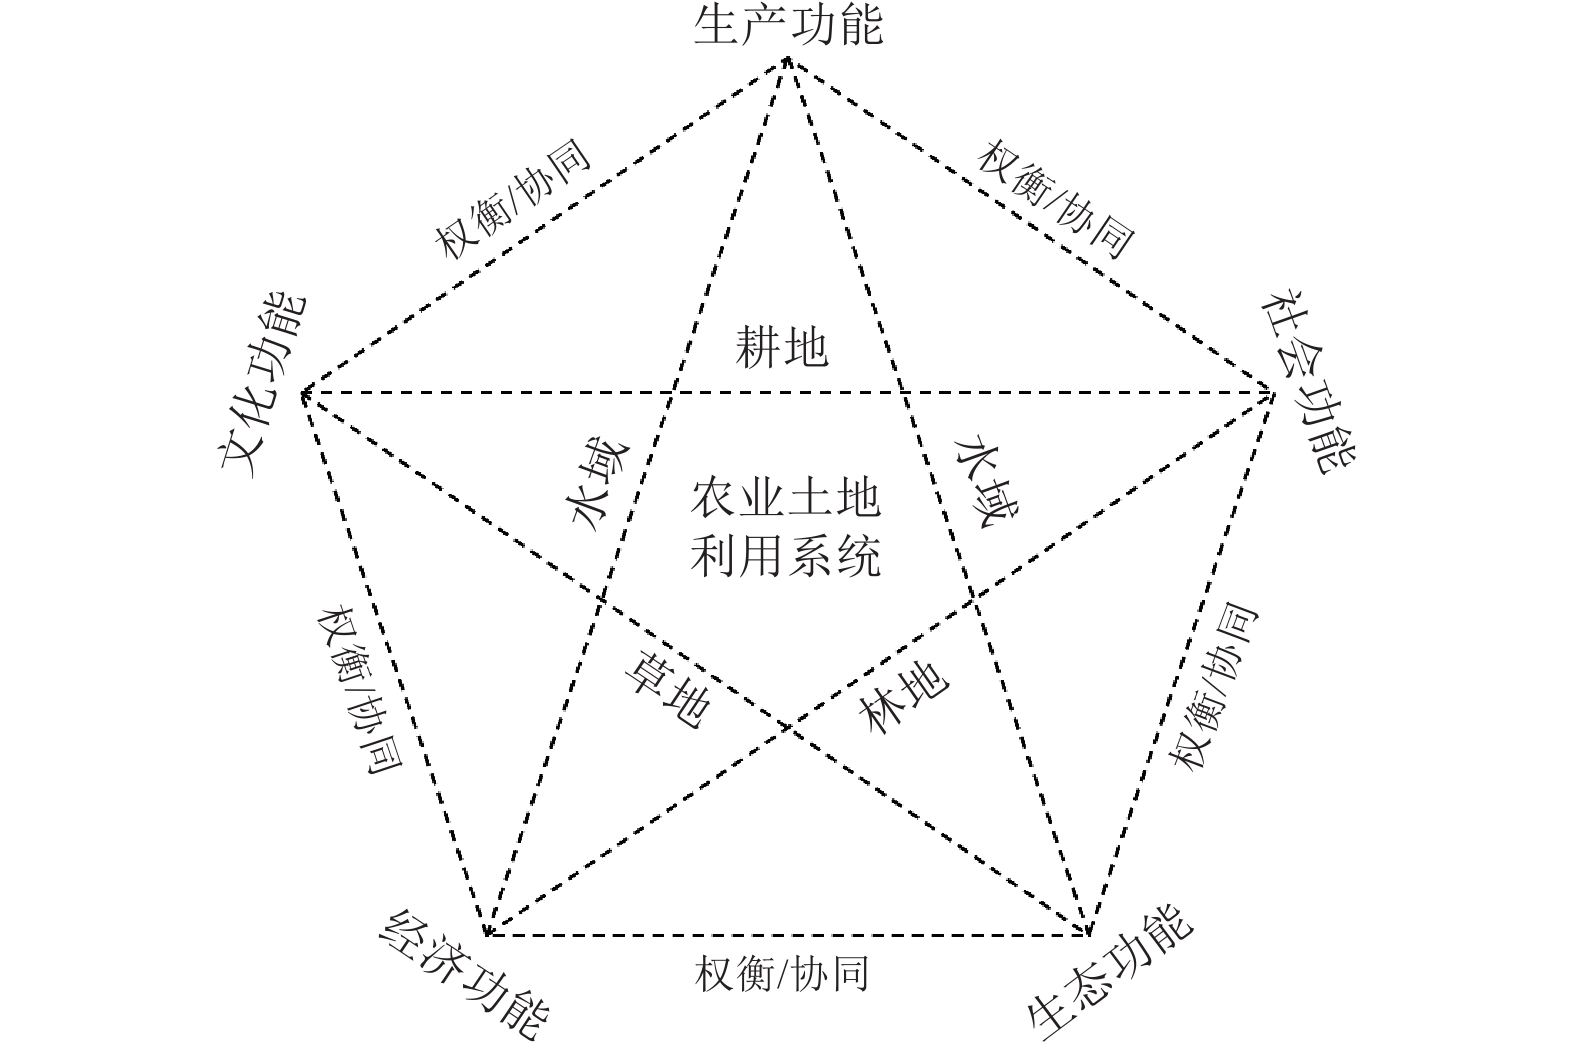
图 1 农业土地系统多功能的类型及关系图
Figure 1. Multifunctional types and relationships of agricultural land use system
![]()
图 2 2020年河南省农业土地利用系统各功能的空间分布
Figure 2. Spatial distribution of agricultural land use system secondary functions in Henan Province in 2020
![]()
图 3 2020年河南省农业土地利用系统多功能的空间分布
Figure 3. Spatial distribution of multifunctional agricultural land use system in Henan Province in 2020
![]()
图 4 2020年河南省农业土地利用系统多功能的数量相关性
Figure 4. Quantitative correlation of multifunctional agricultural land use system in Henan Province in 2020
![]()
图 5 2020年河南省农业土地利用系统多功能的空间相关性
Figure 5. Spatial correlation of multifunctional agricultural land use system in Henan Province in 2020
表 1 农业土地利用系统多功能分析的指标系统
Table 1 Index system for multifunctional analysis of agricultural land use system
主要功能
Major function次级功能
Secondary function农业土地利用类型
Types of agricultural land use量化指标
Quantitative index作用方向
Direction权重
Weight生产功能
Production function (PF)农作物生产 耕地 农作物产量 正向 0.05 林产品生产 林地 林产品产量 正向 0.05 动物产品生产 耕地、草地 动物产品产量 正向 0.05 水产品生产 水域 水产品产量 正向 0.05 生态功能
Ecological function (ELF)气候调节 耕地、林地、草地、水域 固碳量 正向 0.05 水分调节 耕地、林地、草地、水域 产水量 正向 0.05 水土保持 耕地、林地、草地、水域 土壤保持量 正向 0.05 生物多样性 耕地、林地、草地、水域 生境质量 正向 0.05 经济功能
Economic function (ENF)经济保障 耕地、林地、草地、水域 农业产值占比 正向 0.10 经济价值 耕地、林地、草地、水域 单位农用地产值 正向 0.10 社会功能
Social function (SF)生活水平 耕地、林地、草地、水域 农村居民人均恩格尔系数 负向 0.10 社会保障 耕地、林地、草地、水域 农村农业从业人数占比 正向 0.10 文化功能
Cultural function (CF)景观美学 耕地、林地、草地、水域 Shannon's多样性指数 正向 0.10 休闲农业 耕地、林地、草地、水域 休闲农业点的密度 正向 0.10  下载: 导出CSV
表 2 农业土地利用系统各功能测算方法
Table 2 Methods of calculating the functions of agricultural land use system
主要功能
Major function次级功能
Secondary function计算式
Formula计算式解释
Formula interpretation生产功能
Production function (PF)农作物生产 Pcrop(i)=Pcrop(j)C(j)⋅C(i) Pcrop(i) 和 Pcrop(j)分别是农作物在网格i和县j 的产量(kg);C( i)和 C(j) 分别是农作物在网格i和县j 的播种面积(km2);农作物类型包括农作物、油料、蔬菜和瓜果。 林产品生产 Pfore(i)=Pfore(j)F(j)⋅F(i) Pfore(i)和 Pfore(j)分别是林产品的产量(kg);F(i) 和F (j) 分别是林产品的林地面积(km2);林产品 分别为茶叶、水果、坚果和其他林产品。 动物产品生产 Panim(i)=Panim(j)R(j)⋅R(i) Panim(i) 和 Panim(j) 分别是动物产品在网格i和县j 的产量(kg);R(i)和 R (j) 分别是动物产品在网格i和县j 的动物饲养用地面积(km2); 动物产品包含肉类(猪肉、牛肉、羊肉、禽肉)、奶类和禽蛋。 水产品生产 Paqua(i)=Paqua(j)W(j)⋅W(i) Paqua(i)和Paqua (j) 分别是水产品在网格i和县j 的产量(kg);W(i)和 W (j) 分别是网格i和县j 的农业水域面积(km2)。 生态功能
Ecological function (ELF)气候调节 Ct(i)=∑Nj=1At(ij)(Ca+Cb+Cs+Co) Ct(i)是在时间段t 内的碳储量(kg);At(ij)是土地利用类型j在时间段t 内的面积(km2);Ca, Cb, Cs 和Co 分别代表土地利用类型j的地上、地下、土壤和死亡碳库的碳密度。 水分调节 Y(i)=P(1−VAETP) Y(i) 是产水量(mm);VAET 和P分别是实际年蒸散量和年降水量,mm。 水土保持 S(i)=R⋅K⋅LS⋅(1−C⋅P) S(i)为土壤保持量 (t·hm−2·a−1), R、K、LS、C和P分别是网格i的降水侵蚀性因子、土壤侵蚀因子、坡长坡度因子、地表植被覆盖与管理因子和土壤保护措施因子。 生物多样性 Q(i)=H[1−(DziDzi+kz)] Q(i)为网格i的生境质量;H为农业土地利用类型的生境适宜性,z为标度参数,k为半饱和常数,Di为土地利用类型的威胁等级。 经济功能
Economic function (ENF)经济保障 Eprop(i)=EGDP1(j)EGDP(j)⋅Aj(i) Eprop(i)是网格i的第一产业产值占比;EGDP1(j)和 EGDP(j)分别为县j第一产业产值和总产值(元);Aj (i)是网格i县域j内农业土地面积(km2)。 经济价值 EUGDP(i)=EUGDP(j)A(j)⋅A(i) EUGDP(i) 和 EUGDP(j)分别为农业产业类型在网格i和县j的单位面积的产值
(元·km−2);A(i) 和 A(j)分别为农业产业类型在网格i和县j的面
积(km2);农业产业类型包含了农业、林业、牧业和渔业。 社会功能
Social function (SF)生活水平 SEnge(i)=Pfood(j)Pconsumption(j) SEnge(i) 是网格i农村居民的平均恩格尔系数;Pfood( j)和Pconsumption( j)分别为农村居民的食物消费和生活消费。 社会保障 Sprop(i)==PAE(j)PRE(j) Sprop(i)是农村居民农业从业占比,PAE(j)和PRE(j)分别为农村居民农业从业人数和农村居民从业人数(人)。 文化功能Cultural function (CF) 景观美学 CSHDI(i)=−∑Ni=1[Piln(Pi)] CSHDI(i)为网格i的香农多样性指数;Pi为网格i占土地利用总面积的比例,N为研究区土地利用类型总数。 休闲农业 − 对农家乐的POI数据在ArcGIS 中进行核密度分析。
下载: 导出CSV
表 3 食物当量取值表
Table 3 Food equivalent value table
食物类型
Food type粮食
Crops油料
Oil plants蔬菜
Vegetable瓜果
Melon水果
Fruits坚果
Nuts肉类
Meat奶类
Milk禽蛋
Poultry eggs水产品
Aquatic products食物当量
Food equivalent1.0000 2.3087 0.1231 0.4156 0.2232 1.7821 1.1324 0.1946 0.7278 0.9510
下载: 导出CSV
表 4 河南省2020年农业土地利用系统多功能的聚类和相关性占比情况
Table 4 Multifunctional clustering and correlation proportion of agricultural land use system in Henan Province in 2020
% 序号
No.功能组
Functional group聚类情况Clustering condition 相关性 Correlation proportion 不显著
Not significant高—高
High-high低—低
Low-high低—高
Low-low高—低
High-low协同
Synergy权衡
Tradeoff1 生产—生态 32.83 0.04 15.55 18.90 32.68 15.59 51.58 2 生产—经济 46.24 9.31 19.93 13.66 10.86 29.24 24.52 3 生产—社会 35.55 8.42 16.46 18.72 20.84 24.88 39.57 4 生产—文化 33.47 5.62 8.24 24.46 28.21 13.86 52.67 5 生态—经济 46.25 9.50 22.09 13.49 8.68 31.58 22.17 6 生态—社会 35.54 11.27 27.87 15.88 9.45 39.14 25.32 7 生态—文化 33.48 14.77 31.77 15.30 4.67 46.54 19.97 8 经济—社会 35.55 15.53 20.26 11.61 17.05 35.79 28.66 9 经济—文化 33.48 13.67 16.15 16.41 20.30 29.81 36.71 10 社会—文化 33.48 14.54 20.84 15.54 15.61 35.38 31.14
下载: 导出CSV
-
[1] WU W, YU Q Y, PETER V H, et al. How could agricultural land systems contribute to raise food production under global change?[J]. Journal of Integrative Agriculture, 2014, 13(7): 1432-1442. doi: 10.1016/S2095-3119(14)60819-4
[2] VIANA C M, FREIRE D, ABRANTES P, et al. Agricultural land systems importance for supporting food security and sustainable development goals: A systematic review[J]. Science of the Total Environment, 2022, 806.
[3] GLP. Science Plan and Implementation Strategy[R]. IGBP Re-port No.53/IHDP Report No.19.IGBP Secretariat, Stockholm, 2005: 1-64.
[4] VERBURG P H, VAN de Steeg J, VELDKAMP A, et al. From land cover change to land function dynamics: A major challenge to improve land characterization[J]. Journal of Environmental Management, 2009, 90(3): 1327-1335. doi: 10.1016/j.jenvman.2008.08.005
[5] LIU C, XU Y, HUANG A, et al. Spatial identification of land use multifunctionality at grid scale in farming-pastoral area: A case study of Zhangjiakou City, China[J]. Habitat International, 2018, 76: 48-61. doi: 10.1016/j.habitatint.2018.05.010
[6] 陈睿山,蔡运龙,严祥,等. 土地系统功能及其可持续性评价[J]. 中国土地科学,2011,25(1):8-15. doi: 10.13708/j.cnki.cn11-2640.2011.01.004 CHEN Ruishan, CAI Yunlong, YAN Xiang, et al. The functions of land system and its sustainability assessment[J]. China Land Science, 2011, 25(1): 8-15. (in Chinese with English abstract) doi: 10.13708/j.cnki.cn11-2640.2011.01.004
[7] LI X, WU K N, LIANG Y B. A review of agricultural land functions: Analysis and visualization based on bibliometrics[J]. Land, 2023, 561: 1-22.
[8] FLESKENS L, DUARTE F, EICHER I. A conceptual framework for the assessment of multiple functions of agro-ecosystems: A case study of Trás-os-Montes olive groves[J]. Journal of Rural Studies, 2009, 25(1): 141-155. doi: 10.1016/j.jrurstud.2008.08.003
[9] HUANG J, TICHIT M, POULOT M, et al. Comparative review of multifunctionality and ecosystem services in sustainable agriculture[J]. Journal of Environmental Management, 2015, 149: 138-147.
[10] OECD. Multifunctionality: Towards an analytical framework[R].Paris:OECD Publications Service, 2001.
[11] MA. Ecosystems and Human Well-Being: General Synthesis[M]. Washington DC: Island Press, 2005.
[12] LAMPTY B L, BARRON E J, POLLARD D. Impacts of agriculture and urbanization on the climate of the Northeastern United States[J]. Global and Planetary Change, 2005, 49(3/4): 203-221.
[13] FREIBAUER A, ROUNSEVELL M D A, SMITH P, et al. Carbon sequestration in the agricultural soils of Europe[J]. Geoderma, 2004, 122(1): 1-23. doi: 10.1016/j.geoderma.2004.01.021
[14] 刘卫东. 耕地多功能保护问题研究[J]. 国土资源科技管理,2008,25(1):1-5. doi: 10.3969/j.issn.1009-4210.2008.01.001 LIU Weidong. A study of multi-functional protection of cultivated land[J]. Scientific and Technological Management of Land and Resources, 2008, 25(1): 1-5. (in Chinese with English abstract) doi: 10.3969/j.issn.1009-4210.2008.01.001
[15] 胡伟艳,魏安奇,赵志尚,等. 农地多功能供需错位与协同作用研究进展及趋势[J]. 中国土地科学,2017,31(3):89-97. HU Weiyan, WEI Anqi, ZHAO Zhishang, et al. Literature review on mismatch of demand and supply, and synergies of multifunctional agricultural land[J]. China Land Science, 2017, 31(3): 89-97. (in Chinese with English abstract)
[16] ZHANG Y, LONG H, TU S, et al. Spatial identification of land use functions and their tradeoffs/synergies in China: Implications for sustainable land management[J]. Ecological Indicators, 2019, 107: 105550. doi: 10.1016/j.ecolind.2019.105550
[17] FAN Y, GAN L, HONG C, et al. Spatial identification and determinants of trade-offs among multiple land use functions in Jiangsu Province, China[J]. Science of the Total Environment, 2021, 772: 145022. doi: 10.1016/j.scitotenv.2021.145022
[18] 朱从谋,苑韶峰. 杭州市土地利用功能时空权衡特征及影响因素分析[J]. 农业工程学报,2022,38(6):264-273. doi: 10.11975/j.issn.1002-6819.2022.06.030 ZHU Congmou, YUAN Shaofeng. Spatio-temporal characteristics and influencing factors of trade-offs/synergies in land use functions in Hangzhou City, China[J]. Transactions of the Chinese Society of Agricultural Engineering (Transactions of the CSAE), 2022, 38(6): 264-273. (in Chinese with English abstract) doi: 10.11975/j.issn.1002-6819.2022.06.030
[19] 蒙吉军,王祺,李枫,等. 基于空间差异的黑河中游土地多功能利用研究[J]. 地理研究,2019,38(2):369-382. MENG Jijun, WANG Qi, LI Feng. Assessing multifunctional land use in the middle reach ofthe Heihe River basin based on spatial variances[J]. Geographical Research, 2019, 38(2): 369-382. (in Chinese with English abstract)
[20] 姜广辉,张凤荣,孔祥斌,等. 耕地多功能的层次性及其多功能保护[J]. 中国土地科学,2011,25(8):42-47. doi: 10.3969/j.issn.1001-8158.2011.08.007 JIANG Guanghui, ZHANG Fengrong, KONG Xiangbin, et al. The different levels and the protection of multi-functions of cultivated land[J]. China Land Science, 2011, 25(8): 42-47. (in Chinese with English abstract) doi: 10.3969/j.issn.1001-8158.2011.08.007
[21] 范业婷,金晓斌,项晓敏,等. 苏南地区耕地多功能评价与空间特征分析[J]. 资源科学,2018,40(5):980-992. FAN Yeting, JIN Xiaobin, XIANG Xiaomin, et al. Evaluation and spatial characteristics of arable land multifunction in southern Jiangsu[J]. ResourcesScience, 2018, 40(5): 980-992 . (in Chinese with English abstract).
[22] 周丁扬,李抒函,文雯,等. 基于供需视角的河南省耕地多功能评价与优化[J]. 农业机械学报,2020,51(11):272-281. doi: 10.6041/j.issn.1000-1298.2020.11.030 ZHOU Dingyang, LI Shuhan, WEN Wen, et al. Multi-function evaluation and optimization of cultivated land in HenanProvince based on perspective of demand and supply[J]. Transactions of the Chinese Society for Agricultural Machinery, 2020, 51(11): 272-281. (in Chinese with English abstract) doi: 10.6041/j.issn.1000-1298.2020.11.030
[23] 刘黎明. 土地资源学 [M]. 北京:中国农业大学出版社,2002. [24] JIANG G, WANG M, QU Y, et al. Towards cultivated land multifunction assessment in China: Applying the “influencing factors-functions-products-demands” integrated framework[J]. Land Use Policy, 2020, 99(19): 104982.
[25] DE Groot R S. Functions of Nature: Evaluation of Nature in Environmental Planning, Management and Decision Making[M]. Groningen:Wolters-Noordhoff BV, 1992.
[26] DE Groot R S, WILSON M A, BOUMANS R M J. A typology for the classification, description and valuation of ecosystem functions, goods and services[J]. Ecological Economics, 2002, 41: 393-408. doi: 10.1016/S0921-8009(02)00089-7
[27] PÉREZ-SOBA M, PETIT S, JONES L, et al. Land use functions - A multifunctionality approach to assess the impact of land use changes on land use sustainability [M] // Helming K, Pérez-Soba M, Tabbush P, et al. Sustainability Impact Assessment of Land Use Changes. Berlin:Springer Berlin Heidelberg, 2008:375–404.
[28] SCHÖßER B, HELMING K, WIGGERING H. Assessing land use change impacts - A comparison of the sensor land use function approach with other frameworks[J]. Journal of Land Use Science, 2010, 5(2): 159-178. doi: 10.1080/1747423X.2010.485727
[29] PARACCHINI M L, PACINI C, JONES M L M, et al. An aggregation framework to link indicators associated with multifunctional land use to the stakeholder evaluation of policy options[J]. Ecological Indicators, 2011, 11(1): 71-80. doi: 10.1016/j.ecolind.2009.04.006
[30] FAN Y, JIN X, GAN L, et al. Spatial identification and dynamic analysis of land use functions reveals distinct zones of multiple functions in eastern China[J]. Science of the Total Environment, 2018, 642: 33-44. doi: 10.1016/j.scitotenv.2018.05.383
[31] 冯长松,李绍钰,李格. 河南省草地资源现状及开发利用对策[J]. 河南农业科学,2011,40(1):15-18. FENG Changsong, LI Shaoyu, LI Ge. The present situation of natural grassland resource in Henan Province and its development and utilization strategy[J]. Journal of Henan Agricultural Sciences, 2011, 40(1): 15-18. (in Chinese with English abstract)
[32] ZHU C, DONG B, LI S, et al. Identifying the trade-offs and synergies among land use functions and their influencing factors from a geospatial perspective: A case study in Hangzhou, China[J]. Journal of Cleaner Production, 2021, 314: 128026. doi: 10.1016/j.jclepro.2021.128026
[33] 李潇,吴克宁,冯喆,等. 基于固碳服务供需视角的河南省碳平衡研究[J]. 生态学报,2022,42(23):9627-9635. LI Xiao, WU Kening, FENG Zhe, et al. Carbon balance from the perspective of supply and demand of carbon sequeatration services in Henan Province[J]. Acta Ecological Sinica, 2022, 42(23): 9627-9635. (in Chinese with English abstract)
[34] LI X, YU X, WU K N, et al. Land-use zoning management to protecting the regional key ecosystem services: A case study in the city belt along the Chaobai River, China[J]. Science of the Total Environment, 2021, 762: 143167. doi: 10.1016/j.scitotenv.2020.143167
[35] 雷可欣. 多功能视角下的武汉市都市农业发展潜力与分区发展策略研究[D]. 武汉:华中农业大学,2022. LEI Kexin, Urban Agriculture Development Potentiality and Strategy in Wuhan from the Perspective of Multifunctionality[D]. Wuhan: Huazhong Agricultural University, 2022. (in Chinese with English abstract)
[36] 吴健生,罗可雨,赵宇豪. 深圳市近20年城市景观格局演变及其驱动因素[J]. 地理研究,2020,39(8):1725-1738. WU Jiansheng, LUO Keyu, ZHAO Yuhao. The evolution of urban landscape pattern and its drivingforces of Shenzhen from 1996 to 2015[J]. Geographical Research, 2020, 39(8): 1725-1738. (in Chinese with English abstract)
[37] 任继周,侯扶江. 改变传统粮食观,试行食物当量[J]. 草业学报,1999(S1):55-75. Ren Jizhou, Hou Fujiang. Change traditional thinking about food grain production and use food equivalent in yield measurement[J]. Acta Prataculturae Sinica,1999(S1): 55-75. (in Chinese with English abstract)
[38] 孙丕苓,许月卿,刘庆果,等. 环京津贫困带土地利用多功能性的县域尺度时空分异及影响因素[J]. 农业工程学报,2017,33(15):283-292. SUN Piling, XU Yueqing, LIU Qingguo. Spatiotemporal differentiation and driving factors of multi-functionality of land use in county scale in poverty belt around Beijing and Tianjin[J]. Transactions of the Chinese Society of Agricultural Engineering(Transactions of the CSAE),2017,33(15): 283-292. (in Chinese with English abstract)
[39] CUI F, TANG H, ZHANG Q, et al. Integrating ecosystem services supply and demand into optimized management at different scales: A case study in Hulunbuir, China[J]. Ecosystem Services, 2019, 39: 100984. doi: 10.1016/j.ecoser.2019.100984
[40] 姚小薇,曾杰,李旺君. 武汉城市圈城镇化与土地生态系统服务价值空间相关特征[J]. 农业工程学报,2015,31(9):249-256. YAO Xiaowei, ZENG Jie, LI Wangjun. Spatial correlation characteristics of urbanization and land ecosystem service value in Wuhan Urban Agglomeration[J]. Transactions of the Chinese Society of Agricultural Engineering(Transactions of the CSAE),2015,31(9): 249-256. (in Chinese with English abstract)
[41] 陈刚强,李郇,许学强. 中国城市人口的空间集聚特征与规律分析[J]. 地理学报,2008(10):1045-1054. CHEN Gangqiang, LI Xun, XU Xueqiang. Spatial agglomeration and evolution of urban populationin China[J]. Acta Geographica Sinica,2008(10): 1045-1054. (in Chinese with English abstract)
[42] 徐建春,聂路豪,章静仪. 基于多源数据的土地功能评价与相关性分析——以杭州市为例[J]. 地理信息世界,2021,28(6):117-124. XU Jianchun, NIE Luhao, ZHANG Jingyi. Land functionevaluation and correlation analysis based on multi-source data: Take Hangzhou as an example[J]. Geomatics World,2021,28(6): 117-124. (in Chinese with English abstract)
[43] 李小建,周雄飞,郑纯辉. 河南农区经济发展差异地理影响的小尺度分析[J]. 地理学报,2008(2):147-155. LI Xiaojian, ZHOU Xiongfei, ZHENG Chunhui. Geography and economic development in rural China: A township level study in Henan Province, China[J]. Acta Geographica Sinica,2008(2): 147-155. (in Chinese with English abstract)
[44] BRYAN B A, GAO L, YE Y, et al. China’s response to a national land-system sustainability emergency[J]. Nature, 2018, 559(7713): 193-204. doi: 10.1038/s41586-018-0280-2
[45] 冀正欣,刘超,许月卿,等. 基于土地利用功能测度的“三生”空间识别与优化调控[J]. 农业工程学报,2020,36(18):222-231. doi: 10.11975/j.issn.1002-6819.2020.18.027 JI Zhengxin, LIU Chao, XU Yueqing, et al. Identification and optimal regulation of the production-living-ecological space based on quantitative land use functions[J]. Transactions of the Chinese Society of Agricultural Engineering (Transactions of the CSAE), 2020, 36(18): 222-231. (in Chinese with English abstract) doi: 10.11975/j.issn.1002-6819.2020.18.027


计量
- 文章访问数: 120
- HTML全文浏览量: 23
- PDF下载量: 59