Improving the desalination of subsurface drain pipe with envelope adsorption filter using seepage tank test
-
摘要:
农田暗管排水再利用是缓解西北干旱、半干旱地区灌溉水资源短缺的有效途径,而外包滤料的结构与性状是改善暗管出流水质的关键。利用自行研制的渗流槽物理模型试验设备,将取自宁夏银北暗管排水项目区的土样,结合当地盐渍化土壤特征进行重新配置,以吸附性材料代替传统砂滤料,设置了仅敷裹土工布和外裹土工布+10 cm混合滤料两种暗管外包滤料,模拟研究冬灌淋洗盐分条件下,外包滤料结构型式对暗管排水区土壤水盐运移状况的影响及其出口水质状况。监测结果表明:淋洗试验初期,渗水逐渐浸润土壤,土壤中的盐分随水流垂直向下迁移并积聚于暗管周围,即埋深60~90 cm的土层中。淋洗中期,饱和带浸润水位自下而上逐渐上升,仅敷裹土工布的暗管,当饱和带水位超过暗管轴线位置时便开始排水,而包裹混合滤料的暗管,在饱和带水位达到暗管顶部后才开始排水。仅敷裹土工布时土壤整体的平均脱盐率比铺设混合滤料时的小11.45个百分点,两轮淋洗试验后,进入铺设混合滤料暗管水样的平均矿化度较仅敷裹土工布时的水样检测值分别降低了1.89和1.21 g/L,且其暗管排水流量亦明显增大。淋洗后期,试验系统停止供水后,受重力疏干排水滞后效应影响,当饱和带浸润水位接近暗管底部时,暗管排水逐渐衰减,土壤中的盐分多呈现以暗管为中心的凹曲线分布。研究成果可为宁夏银北灌区暗管排水再利用提供参考依据。
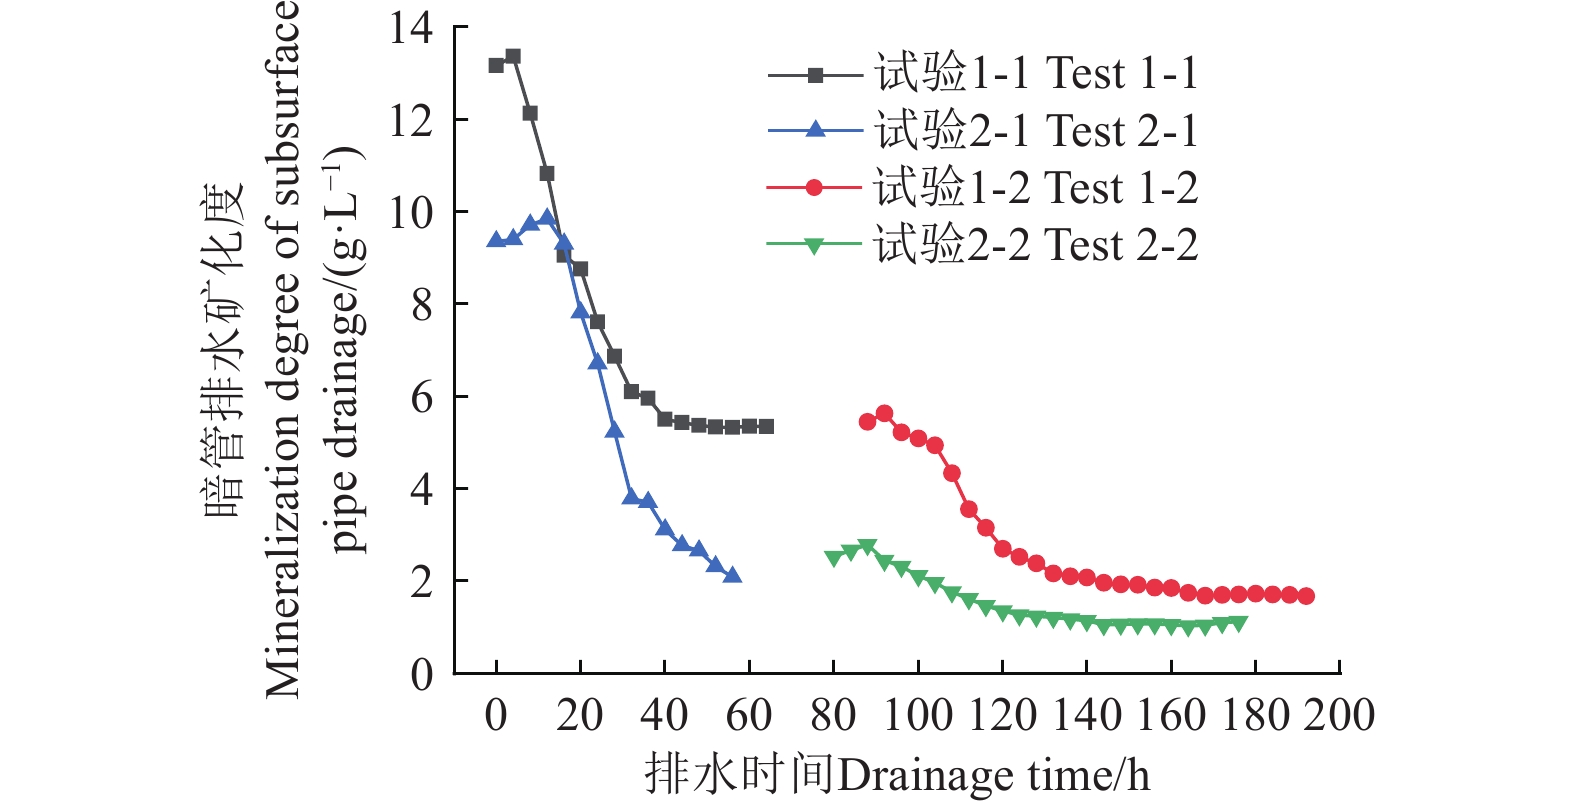
Abstract:Drainage water can be recycled from subsurface pipe networks in farmland, in order to alleviate the shortage of irrigation water resources in the arid and semi-arid regions of Northwest China. The outsourcing filter material and structure of subsurface pipes play a key role in the effluent water quality. In this study, a self-developed seepage tank device was used to simulate and investigate the effects of different outsourcing filter material structures on soil water and salt transport, drainage water quality and flow rate, as well as saturated zone water quality and water level, under winter irrigation and leaching salt conditions. Adsorption materials were used instead of traditional sand filter materials. Two types of outer filter materials were tested, namely geotextile only and geotextile wrapped with 10 cm mixed filter materials. The soil water and salt dynamics were monitored from the start of irrigation to the end of drainage. The results showed that in the early stage of the leaching test, the water gradually infiltrated the soil, where the salt migrated vertically downward with the water flow, and then accumulated around the subsurface pipes in the soil layer at a depth of 60-90 cm. In the mid-stage of leaching, the water level of the saturation zone gradually rose from the bottom to the top. The subsurface pipe with geotextile only started draining, when the water level exceeded the axis of the pipe, whereas, the subsurface pipe wrapped with geotextile and 10 cmmixed filter materials started draining only, after the water level reached the top of the pipe. In terms of the desalination performance, the soil desalination rate of both outer filter materials decreased gradually with the increase of depth. The average desalination rate of the soil with geotextile only was 11.45 percentage points lower than that with mixed filter materials. The average mineralization level of the water samples from the subsurface pipe with the mixed filter materials was reduced by 1.89 and 1.21 g/L, respectively, after subsurface pipe drainage in Test 2-1 (the first round of leaching test of subsurface pipe wrapped with geotextile+10 cm mixed filter material) and Test 2-2 (the second round of leaching test of subsurface pipe wrapped with geotextile+10 cm mixed filter material), compared with the geotextile only. The drainage flow rate also increased significantly, with the maximum drainage flow rate of 6.27 mL/s for Test 2-1 and 2.46 mL/s for Test 2-2. In the late stage of leaching, the drainage stopped under the delayed effect of gravity drainage, when the water level of the saturation zone approached the bottom of the subsurface pipe. The salt in the soil was distributed mainly in a concave curve that centered around the subsurface pipe. The findings can provide a strong reference for the subsurface pipe drainage reuse in the Yinbei irrigation district of Ningxia. Nevertheless, the experimental process cannot consider evaporation, which is one of the main factors of soil salt accumulation. At the same time, the test environment of the seepage tank was greatly varied in the actual farmland drainage from the subsurface pipe project. Therefore, better performance can be expected for the adsorption filter material on the farmland soil.
-
0. 引 言
近几年,随着物流技术的发展,稻谷的跨区域运输越来越频繁。黑龙江作为中国的商品粮基地,其优质的粮食产品在南方市场逐年热销,“北粮南运”的需求在逐渐增加。然而,在“北粮南运”过程中,散粮在运输中因在不同季节跨越不同储粮生态区域常有霉变现象发生。同时,稻谷在贮藏的过程中也有霉变现象发生,霉变导致黄曲霉B1、赭曲霉毒素和呕吐毒素含量超标,给企业带来直接经济损失,给消费者造成健康隐患[1-6]。
光谱分析技术具有分析速度快、非破坏性、测试重现性好、易于实现在线分析和操作简单等诸多优点,已经广泛应用于农业、食品领域[7-9]。近红外光谱覆盖电磁(electromagnetic,EM)光谱的780~2 500 nm范围,可捕获样品在反射、相互作用和透射模式下的光谱,从而提供有关其元素分子键振动的丰富信息[10-11]。在与电磁辐射相互作用时,捕获的光谱包括泛音和组合带,主要涉及氢键官能团(-CH、-NH、-OH-SH)。这种宽带具有很高的信息量,需要化学计量学工具来揭示光谱信息与样品结构特征之间的相关性[12-13]。通过扫描样品,可以获得粮食在霉变过程中有机化合物的含氢基团信息变化,通过特性信息可以建立质量参数与光谱之间的对应关系,结合化学计量学,建立粮食霉变的判别模型[14-15]。
近红外光谱仪是近红外分析的硬件,主要由光源、分束系统、样品检测器、光学检测器以及数据处理分析系统组成[16-17]。TAO等 [18]使用近红外光谱来检测玉米粒表面被黄曲霉毒素 B1 污染,对原始光谱进行导数处理,与使用原始光谱相比,导数处理后的光谱普遍提高了分类模型的性能。CHEN等[19]采用基于不同光谱预处理方法的近红外偏最小二乘法(partial least squares,PLS)模型来预测面团吸水率、面团醒发时间和面团稳定性,每个参数的决定系数(corrlation coefficient of determination,R2)和预测均方根误差(root mean squared error of predicition,RMSEP)分别为0.7和1.560、0.73和1.065以及0.79 和 1.090,预测性能有待进一步提高。龚润华等[20]对红小豆的近红外光谱进行标准正态变量变化法(standard normal variable change method, SNV)、多元散射校正法(multivariate scattering correction method,MSC)及一阶导数预处理,随后结合偏最小二乘分析法(partial least squares,PLS),建立红小豆样品不同品质指标的定量分析模型,各PLS模型能较好地对红小豆的品质指标预测,虽然PLS和PLS-DA模型在其所选取的样本上取得了较好的预测和判别效果,但模型的泛化能力仍需进一步验证。特别是在面对不同产地或不同年份的红小豆时,模型的准确性和稳定性可能会受到影响。蒋雪松等[21]通过阵列式的近红外光谱仪对小麦的霉变程度进行判别,采用平滑、多元散射校正和导数变换等预处理方式消除光谱噪音,再结合主成分分析(principal component analysis,PCA)、线性判别分析(linear discriminant analysis,LDA)和偏最小二乘回归分析(partial least squares regression,PLSR)建立了小麦霉变程度的定性定量分析模型。虽然建立的PLSR模型在预测小麦菌落总数方面表现出较高的精度,但模型的泛化能力尚需进一步验证,对光谱预处理方法还需进行优化,如尝试不同的平滑,以提高光谱数据的准确性和可靠性。吕都等[22]采用近红外光谱技术结合化学计量学方法建立快速鉴别稻谷霉菌污染的判别模型,虽然采用了多种光谱预处理方法,并确定了最佳预处理方式为Quantile Normalization,但其他预处理方法的组合或优化可能未被充分研究。近几年来,采用近红外光谱预处理+化学计量学的分析模式在松子、柑橘、花生、番茄、菠萝等农产品的品质判别中得到了不同程度的研究,但是对霉变稻谷进行快速分级预测仍需要进一步研究[23-28]。
本研究采用近红外光谱法结合不同光谱预处理算法构建定性定量模型,能迅速准确地检测粮食内部质量和安全性,减少人力物力的消耗,为散粮的智能化管控运输提供理论研究基础数据,降低稻谷在运输中以及贮藏时的霉变损失。
1. 材料与方法
1.1 试验材料
试验于2018年收获期采集牡丹江地区的稻谷,品种为牡丹江27号,2019年收获期内采集牡丹江地区的3种稻谷,品种分别为牡丹江27号、龙粳长粒香和牡响1号。将采集的样品进行晾晒,挑除杂质,控制稻谷含水率为14.0%~14.5%,常温储藏,备用。
1.2 仪器设备
TENSORⅡ傅里叶变换近红外光谱仪,德国布鲁克-北京科技有限公司。
1.3 方 法
1.3.1 不同程度霉变样品制备
按1:5(水:稻谷,L/g)的比例将无菌水接入稻谷中,拌匀,分装并密封于3个无菌托盘后置于35 ℃培养箱中。取样前将稻谷再次拌匀,每个托盘取样20次,每次取样50 g,一次取样产生60个样品。取样时间分别为0 d(0 d为未结露),1 d,7 ~8 d和12 ~13 d,总计240组样品。
不同稻谷均采取此处理方法,4种稻谷共计960组样品。如表1所示,从感官指标、霉变粒以及霉菌菌落总数界定稻谷的霉变程度(下文中分别简称为未结露-霉变、结露-霉变前期、结露-霉变中期和结露-霉变后期)划分依据为国家标准中对粮食霉变粒的规定,参考GB/T2715-2016。在制备不同霉变程度的稻谷样品时,依据稻谷霉变粒比例和感官评价,结合霉菌菌落总数的测定,综合判断稻谷的霉变程度,并进行相应的划分。由于样品是在同样湿度和温度下制备的,且不同阶段取样时间间隔较长,并未出现霉变程度与霉变时间不一致的样品。
表 1 结露稻谷霉变程度的界定Table 1. Definition of mildew degree of dewy rice霉变程度
Degree of mildew取样时间
Sampling time/d感官指标
Sensory index霉变粒比例
Proportion of mildew granules/%霉菌菌落总数
Total mold colonies/(CFU·g−1)未结露且未霉变 0 色泽金黄、无异常霉变 0 102~104 结露稻谷霉变前期 1 发软、颜色变暗 0~1 104~105 结露稻谷霉变中期 7 ~8 出现肉眼可见的霉菌生长,影响了食用价值 1~5 105~107 结露稻谷霉变后期 12 ~13 出现大量霉菌生长,彻底失去食用价值 >5 >107 1.3.2 原始光谱的采集
每次取样完成后,将样品置于室温1 h直至样品温度稳定。环境温度为(25±1)℃,相对湿度为20%~30%。因霉变主要发生在稻谷表皮,因此试验采用整粒稻谷进行近红外光谱扫描。在进行光谱扫描之前,肉眼观察并使用显微镜对稻谷进行初步检查,使用记号笔在不破坏表皮的情况下标记霉斑位置。将TENSORⅡ型傅里叶变换近红外光谱仪预热1 h,扫描波数范围设定为11 000~4 000 cm−1,分辨率为8 cm−1,扫描64次,样品重复扫描3次,取其平均光谱[29]。
1.3.3 建立定性模型的试验设计
以梯度随机采样法抽取样品量的2/3作为建模样品集用于模型的建立,1/3作为预测样品集用于模型的验证。在每次取样时参照GB/T 4789. 15-2016[30]测定稻谷的霉菌菌落总数(以3个托盘中稻谷霉菌菌落总数平均值为准)以确定霉变程度。定性建模集样品与预测集样品信息如表2所示。
表 2 基于近红外对稻谷的霉变程度定性判别模型的建模集与预测集样品信息表Table 2. Sample information table of modeling set and prediction set of NIR qualitative discriminant model for rice with different degrees of rice样品
Sample建模样品数
Number of modeling samples预测样品数
Predicted sample number总计
Total2018年牡丹江27号
2018 Mudanjiang 272019年牡丹江27号
2019 Mudanjiang 27龙粳长粒香
Lonjing long grain aromatic rice牡响
1号
Muxiang
No. 12018年牡丹江27号
2018 Mudanjiang 272019年牡丹江27号
2019 Mudanjiang 27龙粳长粒香
Lonjing long grain aromatic rice牡响
1号
Muxiang
No. 1未结露-霉变 40 40 40 40 20 20 20 20 240 结露-霉变初期 40 40 40 40 20 20 20 20 240 结露-霉变中期 40 40 40 40 20 20 20 20 240 结露-霉变后期 40 40 40 40 20 20 20 20 240 1.3.4 建立定量模型的试验设计
为了平衡未发霉稻谷和发霉稻谷的比例,按样品类型定量随机抽取150组未结露稻谷和150组霉变稻谷。300组样品以3:1的比例划分为建模组(200个)和预测组(100个),采用K-折交叉验证法,将获得的300组样品数据集分成4份(K=4),选择其中1份(K=1,n=100)作为验证集检验该模型的判别正确率;3份(K−1,n=200)作为模型训练集(样本集)验证所建模型的准确性和有效性。参照GB/T 4789. 15-2016[30]检测300组稻谷样品的霉菌菌落总数。定量建模样品信息如表3所示。
表 3 基于近红外对稻谷的霉变程度定量判别模型的建模集与预测集样品信息表Table 3. Sample information table of modeling set and prediction set of NIR quantitative discriminant model for rice with different degrees of rice样品
Sample建模样品数
Number of modeling samples预测样品数
Predicted sample number总计
Total2018年牡丹江
27号
2018 Mudanjiang
272019年牡丹江
27号
2019 Mudanjiang
27龙粳长粒香
Lonjing long
grain aromatic
rice牡响1号
Muxiang
No. 12018年牡丹江27号
2018 Mudanjiang
272019年牡丹江
27号
2019 Mudanjiang
27龙粳长粒香
Lonjing long
grain aromatic
rice牡响1号
Muxiang
No. 1未结露-霉变 25 25 25 25 12 13 12 13 150 结露-霉变初期 9 9 9 9 4 5 4 5 150 结露-霉变中期 8 8 8 8 4 4 4 4 结露-霉变后期 8 8 8 8 4 4 4 4 1.3.5 近红外图谱预处理方法与分析判别方法
本研究采用TENSOR II傅里叶变换近红外光谱仪及其自带的分析软件OPUS 7.5进行光谱预处理与分析[31]。鉴于近红外仪器检测时可能受自身及环境因素影响导致图谱带有噪声,且提取的弱信息易重合,增加了分析复杂性。因此,在建模过程中,采用了多种预处理方式,包括不进行预处理、矢量归一化、一阶/二阶导数结合平滑处理等多种组合方法,以优化光谱数据。
在定性模型建立中,采用标准算法和因子化法两种模式识别算法,通过比较测试谱图与模型参考谱图之间的距离进行匹配,距离越短,匹配度越高[32-33]。
在偏最小二乘法(partial least squares,PLS)定量分析模型的构建中,本研究融合了主成分分析(principal component analysis,PCA)、典型相关分析(canonical correlation analysis,CCA)及多元线性回归分析(multivariate linear regression,MLR),目的在于消除复共线关系,简化数据结构,并适用于非线性关系建模。PLS是最流行的多变量校准技术,实际上是一种监督投影技术,类似于PCA。该技术还将新的潜在变量(称为PLS因子)定义为显变量的线性组合,计算结果表示数据和响应之间的最高(PLS1)或剩余(较高PLS因子)协方差[34-35]。为了实现数据可视化,将无监督多变量分析方法主成分分析(PCA)应用于光谱数据。这是一种降维方法,通过将更多的变量转换为更少的数字来减少大型数据集,而不会减少大型数据集中的信息[36-40]。PLS以其高准确度和强稳定性,为粮食霉变的定量分析提供了可靠手段[41-42]。这些处理方法和算法的应用,为粮食霉 变的无损检测提供了科学有效的技术支撑[43-44]。
评估PLS模型的关键指标包括决定系数(corrlation coefficient of determination,R2)、校正均方根误差(root mean square error of calibration,RMSEC)、预测均方根误差(root mean squared error of predicition,RMSEP)、交叉验证的均方根误差(root mean square error of cross-validation,RMSECV)和性能与偏差之比(ratio of performance to deviation,RPD)[45]。其中,R2、RMSECV和RPD共同反映模型精度与稳定性,而RMSEP则直接体现模型实用性。优质PLSR模型应具备高RPD和R2,低RMSECV和RMSEP,且RMSECV>RMSEP。更高的 R2和RMSE越低表示模型越好,RPD越高,RPD越高,模型可靠性越强[46-47]。表4展示了RPD与模型精度的关系。
表 4 剩余预测偏差与模型精度的关系Table 4. Relation between residual prediction deviation(RPD) and model accuracyRPD 模型精度
Model accuracyRPD<1.5 精度低,难以用于定性分析 2>RPD>1.5 模型可用于定性分析 2.5>RPD>2 精度一般,模型具有定量分析的潜力 3>RPD>2.5 精度良好,模型具有定量分析的可行性 RPD>3 精度高,模型可用于实际的定标分析 准确度计算方式为:正确的样本数除以整个样本数。样品之间的距离S值可以衡量定性模型的可行性,当S<1时,表示两类样品之间存在相交关系,模型的鉴别效果极差;当S=1时,表示两类样品之间是相切的关系,模型的鉴别效果一般;当S>1时,表示两类样品是相离的关系,数值越大,模型的鉴别效果越好。判别准确率验证模型的精确度,在满足S>1的条件下,判别准确率越高模型的精确度越高。
2. 结果与分析
稻谷在结露后容易导致霉变的发生,因此,需要对霉变稻谷进行快速识别。在实际的运输中,稻谷的品种和年际不受限制,而这两个因素对近红外光谱信息影响较大。在建立基于近红外光谱对结露稻谷的霉变判别模型时,引入不同品种和年际的稻谷,探究两因素对霉变的判别产生的影响,将有助于提升霉变判别模型的普适性。
2.1 近红外光谱分析
图1展示了结露稻谷在不同霉变阶段的平均光谱图,这些峰谱的变化代表着结露稻谷霉变过程中水分、脂质、淀粉和蛋白质的变化[48]。这些峰谱的相似性反映了稻谷霉变的共性特征。在霉变过程中,尽管霉菌分解了稻谷的营养物质,但由于稻壳的保护,谱峰形态保持相对稳定。为提升模型精度和效率,建模时选择了4 000~9 500 cm−1波数范围,避开了噪声较大的9 500~11 000 cm−1区域。
![]() 图 1 不同品种结露稻谷不同霉变时期的近红外平均光谱Figure 1. Near-infrared average spectrum of different varieties of dewy rice in different mildew period
图 1 不同品种结露稻谷不同霉变时期的近红外平均光谱Figure 1. Near-infrared average spectrum of different varieties of dewy rice in different mildew period在定性模型建立中,通过标准算法和因子化法评估了不同预处理方式的模型性能(表5~表6)。
表 5 不同光谱预处理对标准算法建模准确度的影响Table 5. Effect of different spectral data preprocessing methods on accuracy of standard algorithm modeling预处理方式
Pretreatment modeS值S value 判别准确率Discrimination accuracy rate /% 平均判别准确率Average discriminant accuracy/% 未结露-霉变
No dew - mildew结露-霉变
初期
Dew - early
mildew stage结露-霉变
中期
Dew - mildew metaphase结露-霉变
后期
Dew - mildew stage未结露-霉变
No dew. - mildew结露-霉变
初期
Dew - early
mildew stage结露-霉变
中期
Dew - mildew metaphase结露-霉变
后期
No dew. - mildew无预处理 0.582 0.908 0.905 0.587 67 92 79 21 64.75 矢量归一化 1.161 1.049 1.044 1.166 100 92 93 86 92.75 一阶导数+5点平滑 0.545 0.272 0.273 0.543 87 38 43 93 65.25 一阶导数+9点平滑 0.776 0.414 0.412 0.773 87 54 71 93 76.25 一阶导数+13点平滑 0.947 0.532 0.532 0.942 93 77 79 86 83.75 一阶导数+17点平滑 1.035 0.604 0.604 1.035 93 77 86 86 85.50 一阶导数+矢量归一化+
5点平滑1.109 0.974 0.974 1.109 93 92 86 89 90.0 一阶导数+矢量归一化+
9点平滑0.635 0.359 0.359 0.635 93 23 86 100 75.50 一阶导数+矢量归一化+
13点平滑0.806 0.493 0.493 0.806 74 77 73 72 74.00 一阶导数+矢量归一化+
17点平滑0.909 0.609 0.609 0.909 69 62 78 78 71.75 二阶导数+5点平滑 0.089 0.072 0.072 0.089 0 0 7 0 1.75 二阶导数+9点平滑 0.098 0.076 0.076 0.098 0 0 0 0 0.00 二阶导数+13点平滑 0.131 0.091 0.091 0.131 0 0 0 0 0.00 二阶导数+17点平滑 0.194 0.121 0.121 0.194 0 8 0 0 2.00 二阶导数+矢量归一化+
5点平滑0.214 0.179 0.179 0.214 0 0 0 14 3.50 二阶导数+矢量归一化+
9点平滑0.153 0.124 0.124 0.153 0 0 7 0 1.75 二阶导数+矢量归一化+
13点平滑0.144 0.111 0.111 0.144 0 0 7 0 1.75 二阶导数+矢量归一化+
17点平滑0.180 0.130 0.130 0.180 0 8 7 7 5.50 表 6 不同光谱预处理对因子化法建模准确度的影响Table 6. Effects of different spectral data preprocessing methods on the accuracy of factorization modeling预处理方式
Pretreatment modeS值
S value判别准确率
Discrimination accuracy rate /%平均判别
准确率
Average discriminant accuracy/%未结露-霉变
No dew - mildew结露-霉变
初期
Dew - early mildew stage结露-霉变
中期
Dew - mildew metaphase结露-霉变
后期
Dew - mildew stage未结露-霉变
No dew. - mildew结露-霉变
初期
Dew - early mildew stage结露-霉变
中期
Dew - mildew metaphase结露-霉变
后期
No dew. - mildew无预处理 0.942 0.530 0.533 0.945 93 77 79 86 83.75 矢量归一化 1.091 0.812 0.812 1.096 93 62 79 93 81.75 一阶导数+5点平滑 1.042 1.042 1.127 1.204 93 100 86 86 91.25 一阶导数+9点平滑 1.013 1.013 1.128 1.211 93 100 93 86 93.00 一阶导数+13点平滑 1.001 1.005 1.129 1.213 93 100 93 79 91.25 一阶导数+17点平滑 0.998 0.998 1.122 1.202 93 100 86 79 89.50 一阶导数+矢量归一化+
5点平滑1.138 0.942 0.942 1.138 95 92 86 96 92.25 一阶导数+矢量归一化+
9点平滑1.109 0.974 0.974 1.109 93 92 86 94 91.25 一阶导数+矢量归一化+
13点平滑1.100 0.978 0.978 1.100 93 92 86 98 92.25 一阶导数+矢量归一化+
17点平滑1.097 0.979 0.979 1.097 93 90 82 100 91.25 二阶导数+5点平滑 0.403 0.057 0.057 0.216 7 0 21 0 7.00 二阶导数+9点平滑 0.655 0.100 0.100 0.445 73 0 21 0 23.50 二阶导数+13点平滑 0.651 0.434 0.434 0.651 87 15 43 71 54.00 二阶导数+17点平滑 0.888 0.666 0.666 0.888 80 85 57 100 80.50 二阶导数+矢量归一化+
5点平滑0.002 0.001 0.001 0.008 0 0 7 0 1.75 二阶导数+矢量归一化+
9点平滑0.005 0.005 0.002 0.002 0 0 7 0 1.75 二阶导数+矢量归一化+
13点平滑0.736 0.424 0.424 0.736 67 0 50 86 50.75 二阶导数+矢量归一化+
17点平滑1.045 0.707 0.707 1.045 93 38 79 100 77.50 结果表明,因子化法相较于标准算法表现出更好的模型稳定性和精确度。特别是在一阶导数+平滑预处理后结合因子化法,模型的鉴别效果最佳,对预测集的判别准确率高达93.00%,表明此方法能有效区分不同霉变程度的稻谷。这归因于因子化法能够提取光谱的特征主成分,而标准算法仅依赖平均值尺度识别,提取的关键光谱信息有限。因此,采用一阶导数+平滑+因子化法的建模策略,为结露稻谷霉变程度的定性分析提供了高效准确的手段。
2.2 结露稻谷不同霉变程度定性模型的建立
在以标准算法为分析方法的定性模型中(表5),只有矢量归一化法预处理下S值均大于1,能够将建模集中结露稻谷的不同霉变程度进行区分,且对预测集判别准确率较高,为92.75%。以因子化法分析的定性模型中(表6),一阶导数+平滑的预处理方式具备较好的鉴别效果(S>1)。一阶导数+5点平滑/9点平滑/13点平滑均可以将结露稻谷的不同霉变程度的差异最大化,保证模型的精确度,对预测集的判别准确率最高可达93.00%(一阶导数+9点平滑+因子化法),这说明一阶导数+平滑+因子化法的建模方式对不同霉变程度的判别稳定性较好。
综合来看,因子化法比标准算法具备更好的模型稳定性和精确度,这主要归功于因子化法可以提取光谱的特征主成分参与到模式识别中,而标准算法只是平均值尺度的识别,提取的关键光谱信息不足
采用一阶导数+9点平滑+因子化法建立的判别模型,结果如图2所示,能明显区分结露稻谷的不同霉变程度,展现出高稳定性和准确性。尽管“结露-霉变前期”与“结露-霉变中期”略有重叠,这可能与霉菌生长速度和人工分辨误差有关。稻谷品种和年限对聚类区块分离趋势产生影响,尤其在“未结露-霉变”和“结露-霉变后期”最为显著。
![]() 图 2 结露稻谷不同霉变程度的因子分析判别函数得分图Figure 2. Factor analysis discriminant function score of rice with different degrees of mildew after dew-formation
图 2 结露稻谷不同霉变程度的因子分析判别函数得分图Figure 2. Factor analysis discriminant function score of rice with different degrees of mildew after dew-formation2.3 结露稻谷霉菌总数的定量模型的建立
采用不同的光谱预处理方式建立稻谷霉菌总数的定量分析模型如表7所示,结果显示,不进行预处理、消除常数偏移量、减去一条直线、最小-最大归一化法和多元散射校正等方法对建模集均有良好表现。但求导预处理导致模型精度和稳定性下降[49]。相比而言,矢量归一化法、最小-最大归一化法和多元散射校正提高了模型精度。
表 7 不同光谱预处理方式对定量分析模型的影响Table 7. Effects of different spectral data preprocessing methods on quantitative analysis models光谱预处理方式
Spectral pretreatment method交叉验证的均方根误差
RMSECVR2 维数
DimensionRPD 无预处理
No preprocessing0.576 0.866 5 9 2.74 消除常数偏移量
Eliminate constant offsets0.577 0.865 7 9 2.73 减去一条直线
Subtract a line0.599 0.855 5 8 2.63 矢量归一化法
Vector normalization method0.546 0.879 7 9 2.88 最小-最大归一化法
Minimum-maximum normalization method0.542 0.881 6 8 2.91 多元散射校正
Multivariate scattering correction0.558 0.874 7 9 2.83 一阶导数+5点平滑
First derivative +5 points smooth0.801 0.741 5 3 1.97 一阶导数+9点平滑
First derivative +9 point smoothing0.774 0.758 4 4 2.04 一阶导数+13点平滑
First derivative +13 points smooth0.759 0.768 1 7 2.08 一阶导数+17点平滑
First derivative +17 points smooth0.694 0.805 9 7 2.27 二阶导数+5点平滑
Second derivative +5 points smooth0.352 0.712 9 5 1.21 二阶导数+9点平滑
Second derivative +9 points smooth0.389 0.762 3 4 1.28 二阶导数+13点平滑
Second derivative +13 points smooth0.432 0.811 7 3 1.33 二阶导数+17点平滑
Second derivative +17 points smooth0.497 0.822 3 2 1.41 一阶导数+减去一条直线+5点平滑
First derivative + minus a straight line +5 points of smoothing0.718 0.837 0 3 1.88 一阶导数+减去一条直线+9点平滑
First derivative + minus a straight line +9 points of smoothing0.702 0.860 0 3 1.83 一阶导数+减去一条直线+13点平滑
First derivative + minus a straight line +13 points of smoothing0.729 0.820 0 6 1.92 一阶导数+矢量归一化+5点平滑
First derivative + vector normalization + 5-point smoothing0.769 0.758 0 3 2.08 一阶导数+矢量归一化+9点平滑
First derivative + vector normalization +9 point smoothing0.752 0.784 0 3 2.01 一阶导数+矢量归一化+13点平滑
First derivative + vector normalization + 13-point smoothing0.756 0.778 0 4 2.02 一阶导数+多元散射校正+5点平滑
First derivative + multiple scattering correction +5 point smoothing0.764 0.766 0 3 2.06 一阶导数+多元散射校正+9点平滑
First derivative + multiple scattering correction +9 point smoothing0.745 0.796 0 3 1.98 一阶导数+多元散射校正+13点平滑
First derivative + multivariate scattering correction + 13-point smoothing0.747 0.792 0 4 1.99 以不同光谱预处理方式建立稻谷霉菌总数的定量分析模型,矢量归一化法、最小-最大归一化法和多元散射校正则都提高了模型的精度。但对光谱进行一阶导数加平滑处理后,建模维数降低,说明求导处理减少了原始图谱的信息,有效信息也同时减少,降低了模型的精度和稳定性。因此结合建模结果采用适量归一化法建立定量模型。在定性模型建立过程中,因子化法可以提取光谱的特征主成分参与到模式识别,一阶导数平滑均可以将结露稻谷的不同霉变程度的差异最大化,保证模型的精确度,对预测集的判别准确率最高。
运用近红外光谱建立预测模型时,化学值异常和光谱异常的存在会严重影响模型的精度,需剔除化学值和光谱异常数据以确保模型精度[50]。如表8所示,经过优化,矢量归一化法成为最优预处理方式。使用该方法建立的PLS分析模型在预测集上表现出色,RPD为3.24,RMSEP为0.450,证明了其高预测准确性。
表 8 校正后的定量分析模型的精度Table 8. Precision of the quantitative analysis model after correction光谱预处理方式
Spectral pretreatment methodRMSECV R2 RPD 预测均方
根误差
RMSEP矢量归一化法
Vector normalization method0.470 0.904 5 3.24 0.450 最小-最大归一化法
Minimum-maximum normalization method0.517 0.886 9 3.01 0.490 多元散射校正
Multivariate scattering correction0.501 0.898 5 3.14 0.466 关于PLS选择的变量数,首先通过不同的光谱预处理方法(矢量归一化法、最小-最大归一化法和多元散射校正)建立了稻谷霉菌总数的定量分析模型。其中化学值异常和光谱异常的存在会对其模型产生影响,因此需剔除这些异常数据以确保模型的准确性。通过研究发现,矢量归一化法是最优的预处理方式,其关键指标为:RMSECV为0.546,R2为0.8797 ,维数为9,RPD为2.88。经过多次调整维数,得到不同的均方根误差(RMSE)和R2值,选择RMSE最低、R2最高的维数作为最佳维数。而维数的选择直接影响模型的复杂性和预测能力,为避免过拟合或欠拟合,进一步地进行逐步实验,最终确定维数为9时模型性能最佳。因此,PLS的变量数为9。
通过矢量归一法预处理和PLS定量分析拟合的稻谷菌落总数与近红外光谱预测值的相关性结果如图3,建模集和验证集的样品点均匀分布在拟合线两侧,显示出高相关性。不同年际和品种的稻谷样品在各菌落总数区段分布均匀,表明近红外光谱结合PLS模型可定量检测结露稻谷的菌落总数,且受“年际”和“品种”因素影响较小。
![]() 图 3 稻谷菌落总数与近红外光谱预测值的相关关系Figure 3. Correlation between total number of rice colonies and predicted value of near-infrared spectrum
图 3 稻谷菌落总数与近红外光谱预测值的相关关系Figure 3. Correlation between total number of rice colonies and predicted value of near-infrared spectrum3. 结 论
以不同温湿度条件下稻谷的霉变程度作为建模研究样品,建立了不同霉变程度的定性和定量分析,模型可用于不同温湿度运输条件下稻谷的霉变情况判别,霉变依据国家标准霉变粒率,以及稻谷霉菌数用于样品建模分级,本研究制备不同霉变程度稻谷作为研究对象,通过从感官指标、霉变粒以及霉菌菌落总数界定稻谷的霉变程度。基于因子化和偏最小二乘算法对稻谷霉变快速分级预测,主要结论如下:
1)基于近红外光谱对4种稻谷样品建立了其不同霉变程度的定性判别模型,其中一阶导数+9点平滑+因子化法建立的定性判别模型准确度较高,样品之间的距离S均值大于1,分辨效果好,借助留一交互验证验证模型的平均准确率为93.00%。
2)基于近红外光谱对4种共300组稻谷样品建立了霉菌菌落总数的定量模型,通过矢量归一化法+偏最小二乘法(partial least squares,PLS)定量分析建立的定量判别模型,其交叉验证的均方根误差(root mean square error of cross-validation,RMSECV)、决定系数(corrlation coefficient of determination,R2)、性能与偏差之比(ratio of performance to deviation,RPD)和预测均方根误差(root mean squared error of predicition,RMSEP)分别为0.47、0.904 5、3.24和0.45,经过分析方法优选后而建立的霉变判别模型显示,霉变是影响近红外光谱变化的主导因素,而稻谷的品种与年际对其影响较小。
以上定性定量模型可以对不同运输过程中的稻谷实现快速预测其霉变程度或其霉菌数量,未来可研发模型搭载平台由实验室大型精密设备转化为便携式小型设备,研制在线实时监测装备用于集装箱内粮食霉变情况监控。
-
![]()
图 2 两种外包滤料型式条件下饱和带浸润水位以及水平均矿化度随排水时间的动态变化
Figure 2. Dynamic changes of infiltration water level and horizontal average salinity of saturated zone with drainage time under the condition of two types of subsurface pipe outsourcing filter material
![]()
图 3 两种滤料型式的暗管控制的土壤剖面含水率随排水时间的动态变化
Figure 3. Dynamic change of soil profile moisture content with drainage time under the condition of two types of subsurface pipe outsourcing filter material
![]()
图 4 两种暗管外包滤料型式条件下土壤剖面盐分分布
Figure 4. Salt distribution of soil profile under the condition of two types of subsurface pipe outsourcing filter material
![]()
图 5 两种外包滤料型式暗管排水流量的动态变化情况
Figure 5. Dynamic changes of drainage flow under the condition of two types of subsurface pipe outsourcing filter material
![]()
图 6 两种暗管外包滤料型式对排水矿化度的影响变化
Figure 6. Influence under the condition of two types of subsurface pipe outsourcing filter material on drainage mineralization degree
表 1 土壤物理性质
Table 1 Soil physical properties
土层
Soil horizon/cm颗粒组成体积分数
Particle composition/%土壤质地
Soil texture土壤容重
Soil bulk density/(g·cm−3)饱和(体积)含水率
Saturated water content/%饱和渗透系数
Saturated permeability coefficient/(cm·d−1)粉粒Silt 黏粒Clay 砂粒Sand 0~30 33.97 7.67 58.36 砂质壤土 1.57 38.66 34.46 >30~60 25.37 9.07 65.56 砂质壤土 1.76 35.81 21.82 >60~90 28.88 11.91 59.21 砂质壤土 1.89 32.97 7.62 >90~110 28.97 12.06 58.97 砂质壤土 1.99 31.90 6.53  下载: 导出CSV
表 2 淋洗试验灌排参数表
Table 2 Table of irrigation parameters for leaching test
滤料型式
Filter type编号
No.灌水日期
Irrigation
date历时Duration/h 淋洗水量Leaching
water /mm灌水
Irrigation排水
Drainage仅敷裹土工布
Only coated
geotextiles1-1 2022-07-24 39.5 67 346 1-2 2022-07-27 74 106 269 外裹土工布
+10 cm混合滤料
Covered geotextile
+ 10 cm mixed filter
material2-1 2022-08-11 41 60 346 2-2 2022-08-15 65.5 100 269 注:编号中-1、-2分别代表第1轮和第2轮淋洗试验。下同。 Note: Number -1 and -2 represent the first and second round of leaching tests, respectively. Same below.
下载: 导出CSV
表 3 两种暗管外包滤料型式条件下淋洗前后各层土壤脱盐率
Table 3 Soil desalination rate of each layer before and after leaching under the condition of two types of subsurface pipe outer filter material
型式
Type编号No. 距暗管水平距离
Horizontal distance from the dark tube /cm脱盐率Desalination rate/% 平均Average/% 0~30 cm >30~60 cm >60~90 cm >90~110 cm 仅敷裹土工布
Only coated geotextiles1-1 20 89.64 51.42 69.16 21.80 58.00 70 86.78 73.48 55.01 56.30 67.89 120 88.87 54.32 45.72 40.14 57.26 170 86.69 69.79 30.00 23.06 52.38 平均 87.99 62.25 49.97 35.33 58.89 1-2 20 9.85 43.29 63.48 72.06 47.17 70 16.06 52.67 50.70 66.32 46.44 120 12.05 44.83 45.89 50.60 38.34 170 55.79 44.03 53.03 56.97 52.45 平均 23.44 46.21 53.28 61.49 46.10 敷裹土工布+10 cm混合滤料
Covered geotextile + 10 cm
mixed filter material2-1 20 89.86 51.49 78.23 62.54 70.53 70 93.48 73.66 82.82 57.40 76.84 120 75.23 68.02 70.11 68.14 70.38 170 75.96 79.96 68.41 30.12 63.61 平均 83.63 68.28 74.89 54.55 70.34 2-2 20 22.68 26.58 28.29 19.57 24.28 70 33.95 48.92 21.25 35.93 35.01 120 23.20 40.67 39.62 44.80 37.07 170 61.13 38.61 51.64 48.99 50.10 平均 35.24 38.70 35.20 37.32 36.62
下载: 导出CSV
-
[1] 赵文娟,黄凌. 宁夏银北试验区盐渍土壤盐分运移数值模拟[J]. 人民黄河,2018,40(2):152-156. ZHAO Wenjuan, HUANG Ling. Numerical simulation of salt movement in yinbei area of Ningxia autonomous region[J]. Yellow River, 2018, 40(2): 152-156. (in Chinese with English abstract)
[2] 李重阳,宋豫秦. 宁夏银北灌区土壤盐渍化时空分布特征[J]. 人民黄河,2014,36(8):134-136,140. LI Chongyang, SONG Yuqin. Spatial-temporal distribution characteristics of soil salinization in Northern Yinchuan Plain of Ningxia[J]. Yellow River, 2014, 36(8): 134-136, 140. (in Chinese with English abstract)
[3] 王瑞萍,万核洋,陈帅,等. 河套灌区乌拉特灌域春季土壤盐碱化空间分布特征[J]. 农业工程学报,2021,37(15):105-113. WANG Ruiping, WAN Heyang, CHEN Shuai, et al. Spatial distribution pattern of soil salinization in farmland of Wulate sub-irrigation areas in Hetao Irrigation District in Inner Mongolia in spring[J]. Transactions of the Chinese Society of Agricultural Engineering(Transactions of the CSAE), 2021, 37(15): 105-113. (in Chinese with English abstract)
[4] 马利军,王红雨,麦文慧,等. 宁夏银北灌区暗管排水技术应用现状调查分析[J]. 中国农村水利水电,2019(2):71-74,79. MA Lijun, WANG Hongyu, MAI Wenhui, et al. Investigation and analysis of application of underground pipe drainage technology in Yinbei irrigation area of Ningxia[J]. China Rural Water and Hydropower, 2019(2): 71-74, 79. (in Chinese with English abstract)
[5] 王少丽,许迪,方树星,等. 宁夏银北灌区农田排水再利用水质风险评价[J]. 干旱地区农业研究,2010,28(3):43-47. WANG Shaoli, XU Di, FANG Shuxing, et al. Evaluation of water quality hazard of drainage reusein Yinbei irrigation district, Ningxia[J]. Agricultural Research in the Arid Areas, 2010, 28(3): 43-47. (in Chinese with English abstract)
[6] 谭攀,王士超,付同刚,等. 我国暗管排水技术发展历史、现状与展望[J]. 中国生态农业学报(中英文),2021,29(4):633-639. TAN Pan, WANG Shichao, FU Tonggang, et al. Development history, present situation, and the prospect of subsurface drainage technology in China[J]. Chinese Journal of Eco-Agriculture, 2021, 29(4): 633-639. (in Chinese with English abstract).
[7] 李杰,王红雨,王亚,等. 基于回归水再利用的农田排水暗管外包滤料选型试验[J]. 节水灌溉,2022(11):18-25. LI Jie, WANG Hongyu, WANG Ya, et al. An experimental investigation of envelopes filter material based on reuse of returned water from subsurface drainage tubing[J]. Water Saving Irrigation, 2022(11): 18-25. (in Chinese with English abstract)
[8] ABEDI-KOUPAI J, ANSARI S, MOSTAFAZADEH-FARD B, et al. Experimental study and numerical simulation of soil water and salt transport under dry drainage conditions[J]. Environmental Earth Sciences,2020,79(4): 89.
[9] 张金龙,刘明,钱红,等. 漫灌淋洗暗管排水协同改良滨海盐土水盐时空变化特征[J]. 农业工程学报,2018,34(6):98-103. ZHANG Jinlong, LIU Ming, QIAN Hong, et al. Spatial-temporal variation characteristics of water- salt movement in coastal saline soil improved by flooding and subsurface drainage[J]. Transactions of the Chinese Society of Agricultural Engineering(Transactions of the CSAE), 2018, 34(6): 98-103. (in Chinese with English abstract)
[10] 迟碧璇,史海滨,许迪,等. 控制暗管排水下土壤剖面水盐分布与变化特征[J]. 农业工程学报,2021,37(4):148-158. doi: 10.11975/j.issn.1002-6819.2021.4.018 CHI Bixuan, SHI Haibin, XU Di, et al. Distribution and variation of water and salt in soil profile under controlling subsurface drainage[J]. Transactions of the Chinese Society of Agricultural Engineering(Transactions of the CSAE), 2021, 37(4): 148-158. (in Chinese with English abstract) doi: 10.11975/j.issn.1002-6819.2021.4.018
[11] ZHANG J, WERNER A D, LU C. Improving salt leaching efficiency of subsurface drainage systems using low-permeability surface mulch[J]. Advances in Water Resources, 2022, 162: 104147. doi: 10.1016/j.advwatres.2022.104147
[12] YU X, DAN H C, XIN P. Method for improving leaching efficiency of coastal subsurface drainage systems[J]. Journal of Irrigation & Drainage Engineering, 2018, 144(8): 4018011-4018019.
[13] 李显溦,左强,石建初,等. 新疆膜下滴灌棉田暗管排盐的数值模拟与分析Ⅱ:模型应用[J]. 水利学报,2016,47(5):616-625. LI Xianwei, ZUO Qiang, SHI Jianchu, et al. Evaluation of salt discharge by subsurface pipes in the cotton field with film mulched drip irrigation in Xinjiang, China Ⅱ: Calibration to models and parameters[J]. Journal of Hydraulic Engineering, 2016, 47(5): 616-625. (in Chinese with English abstract)
[14] 秦文豹,李明思,李玉芳,等. 滴灌条件下暗管滤层结构对排水、排盐效果的影响[J]. 灌溉排水学报,2017,36(7):80-85. doi: 10.13522/j.cnki.ggps.2017.07.015 QIN Wenbao, LI Mingsi, LI Yufang, et al. Effect of biogas slurry on photosynthesis, yield and quality of lettuce grown in hydroponic culture[J]. Journal of Irrigation and Drainage, 2017, 36(7): 80-85. (in Chinese with Englisha bstract) doi: 10.13522/j.cnki.ggps.2017.07.015
[15] TAO Y, WANG S, XU D, et al. Field and numerical experiment of an improved subsurface drainage system in Huaibei plain[J]. Agricultural Water Management, 2017, 194: 24-32. doi: 10.1016/j.agwat.2017.07.015
[16] 陈名媛,黄介生,曾文治,等. 外包土工布暗管排盐条件下水盐运移规律[J]. 农业工程学报,2020,36(2):130-139. CHEN Mingyuan, HUANG Jiesheng, ZENG Wenzhi, et al. Characteristics of water and salt transport in subsurface pipes with geotextiles under salt discharge conditions[J]. Transactions of the Chinese Society of Agricultural Engineering (Transactions of the CSAE), 2020, 36(2): 130-139. (in Chinese with English abstract)
[17] 王建伟,王琳,严登华,等. 宁夏引黄灌区末段区域农业水资源配置研究[J]. 水利水电技术,2017,48(3):65-70. WANG Jianwei, WANG Lin, YAN Denghua, et al. Study on water resources allocation of agriculture in the end piece of Yellow River irrigation region in Ningxia[J]. Water Resources and Hydropower Engineering, 2017, 48(3): 65-70. (in Chinese with English abstract)
[18] 刘洪光,白振涛,李开明. 基于HYDRUS-2D模型的膜下滴灌暗管排水棉田土壤盐分变化[J]. 农业工程学报,2021,37(2):130-141. LIU Hongguang, BAI Zhentao, LI Kaiming. Soil salinity changes in cotton field under mulched drip irrigation with subsurface pipes drainage using HYDRUS-2D model[J]. Transactions of the Chinese Society of Agricultural Engineering (Transactions of the CSAE), 2021, 37(2): 130-141. (in Chinese with English abstract)
[19] 何文寿,刘阳春,何进宇. 宁夏不同类型盐渍化土壤水溶盐含量与其电导率的关系[J]. 干旱地区农业研究,2010,28(1):111-116. HE Wenshou, LIU Yangchun, HE Jinyu. Relationships between soluble salt content and electrical conductivity for different types of salt-affected soils in Ningxia[J]. Agricultural Research in the Arid Areas, 2010, 28(1): 111-116. (in Chinese with English abstract)
[20] 石培君,刘洪光,何新林,等. 基于HYDRUS模型的暗管排水水盐运移模拟[J]. 干旱地区农业研究,2019,37(3):224-231. SHI Peijun, LIU Hongguang, HE Xinlin, et al. The simulation of water and salt transportation undersubsurface drainage by HYDRUS model[J]. Agricultural Research in the Arid Areas, 2019, 37(3): 224-231. (in Chinese with English abstract)
[21] GAJ NARESH , MADRAMOOTOO C A . Effects of perforation geometry on pipe drainage in agricultural lands[J]. Journal of Irrigation and Drainage Engineering, 2020, 146(7): 04020015.
[22] 王国帅,史海滨,李仙岳,等. 河套灌区不同地类盐分迁移估算及与地下水埋深的关系[J]. 农业机械学报,2020,51(8):255-269. WANG Guoshuai, SHI Haibin, LI Xianyue, et al. Estimation of salt transport and relationship with groundwater depth in different land types in hetao irrigation area[J]. Transactions of the Chinese Society for Agricultural Machinery, 2020, 51(8): 255-269. (in Chinese with English abstract)
[23] 刘玉国,杨海昌,王开勇,等. 新疆浅层暗管排水降低土壤盐分提高棉花产量[J]. 农业工程学报,2014,30(16):84-90. LIU Yuguo, YANG Haichang, WANG Kaiyong, et al. Shallow subsurface pipe drainage in Xinjiang lowers soil salinity and improves cotton seed yield[J]. Transactions of the Chinese Society of Agricultural Engineering (Transactions of the CSAE), 2014, 30(16): 84-90. (in Chinese with English abstract)
[24] KHOSLA B K, GUPTA R K, ABROL I P. Salt leaching and the effect of gypsum application in a saline-sodic soil[J]. Agricultural Water Management, 1979. DOI: 10.1016/0378-3774(79)90002-7.
[25] 石培君,刘洪光,何新林,等. 膜下滴灌暗管排水规律及土壤脱盐效果试验研究[J]. 排灌机械工程学报,2020,38(7):726-730. SHI Peijun, LIU Hongguang, HE Xinlin, et al. Experiments on drainage rule and soil desalination effect under mulched subsurface pipe drainage[J]. Journal of Drainage and Irrigation Machinery Engineering, 2020, 38(7): 726-730. (in Chinese with English abstract)
[26] TAO Y, WANG S, XU D, et al. Experiment and analysis on flow rate of improved subsurface drainage with ponded water[J]. Agricultural Water Management, 2016, 177: 1-9. doi: 10.1016/j.agwat.2016.05.016
[27] MIN H S , XIANG T K , JING L X , et al. Transport ation of soil water and salt in the process of infiltration and evaporation under drip irrigation[J]. Journal of Agricultural University of Hebei, 2002, 767(2): 255-62.
[28] RITZEMA H P, SATYANARAYANA T V, RAMAN S, et al. Subsurface drainage to combat waterlogging and salinity in irrigated lands in India: Lessons learned in farmers' fields[J]. Agricultural Water Management, 2008, 95(3): 179-189.
[29] 岳卫峰,杨金忠,童菊秀,等. 干旱地区灌区水盐运移及平衡分析[J]. 水利学报,2008,39(5):623-626,632. YUE Weifeng, YANG Jinzhong, TONG Juxiu, et al. Transfer and balance of water and salt in irrigation district of arid region[J]. Journalof Hydraulic Engineering, 2008, 39(5): 623-626, 632. (in Chinese with English abstract)
-
期刊类型引用(4)
1. 曹一征,朱国俊,宣奕帆,唐振博,王李科. 启动方式对混流泵内主轴振动和压力脉动特性的影响. 水电与抽水蓄能. 2025(01): 102-108 .  百度学术
百度学术
2. 卢金玲,王阳,代俊航,朱国俊,宣奕帆,王李科. 降速方式对混流泵压力脉动特性的影响. 农业工程学报. 2024(12): 86-95 . 本站查看
3. 陈学炳,杨博文,张人会,郭广强,杨军虎. 离心泵进口来流速度扰动不确定性对水力性能及流场的影响. 农业工程学报. 2024(12): 77-85 . 本站查看
4. 朱国俊,唐振博,冯建军,罗兴锜. 启动方式对混流泵噪声特性的影响. 农业工程学报. 2023(13): 34-42 . 本站查看
其他类型引用(2)


计量
- 文章访问数: 118
- HTML全文浏览量: 24
- PDF下载量: 52
- 被引次数: 6