A handheld non-destructive intelligent detection and grading device for the freshness of pork
-
摘要:
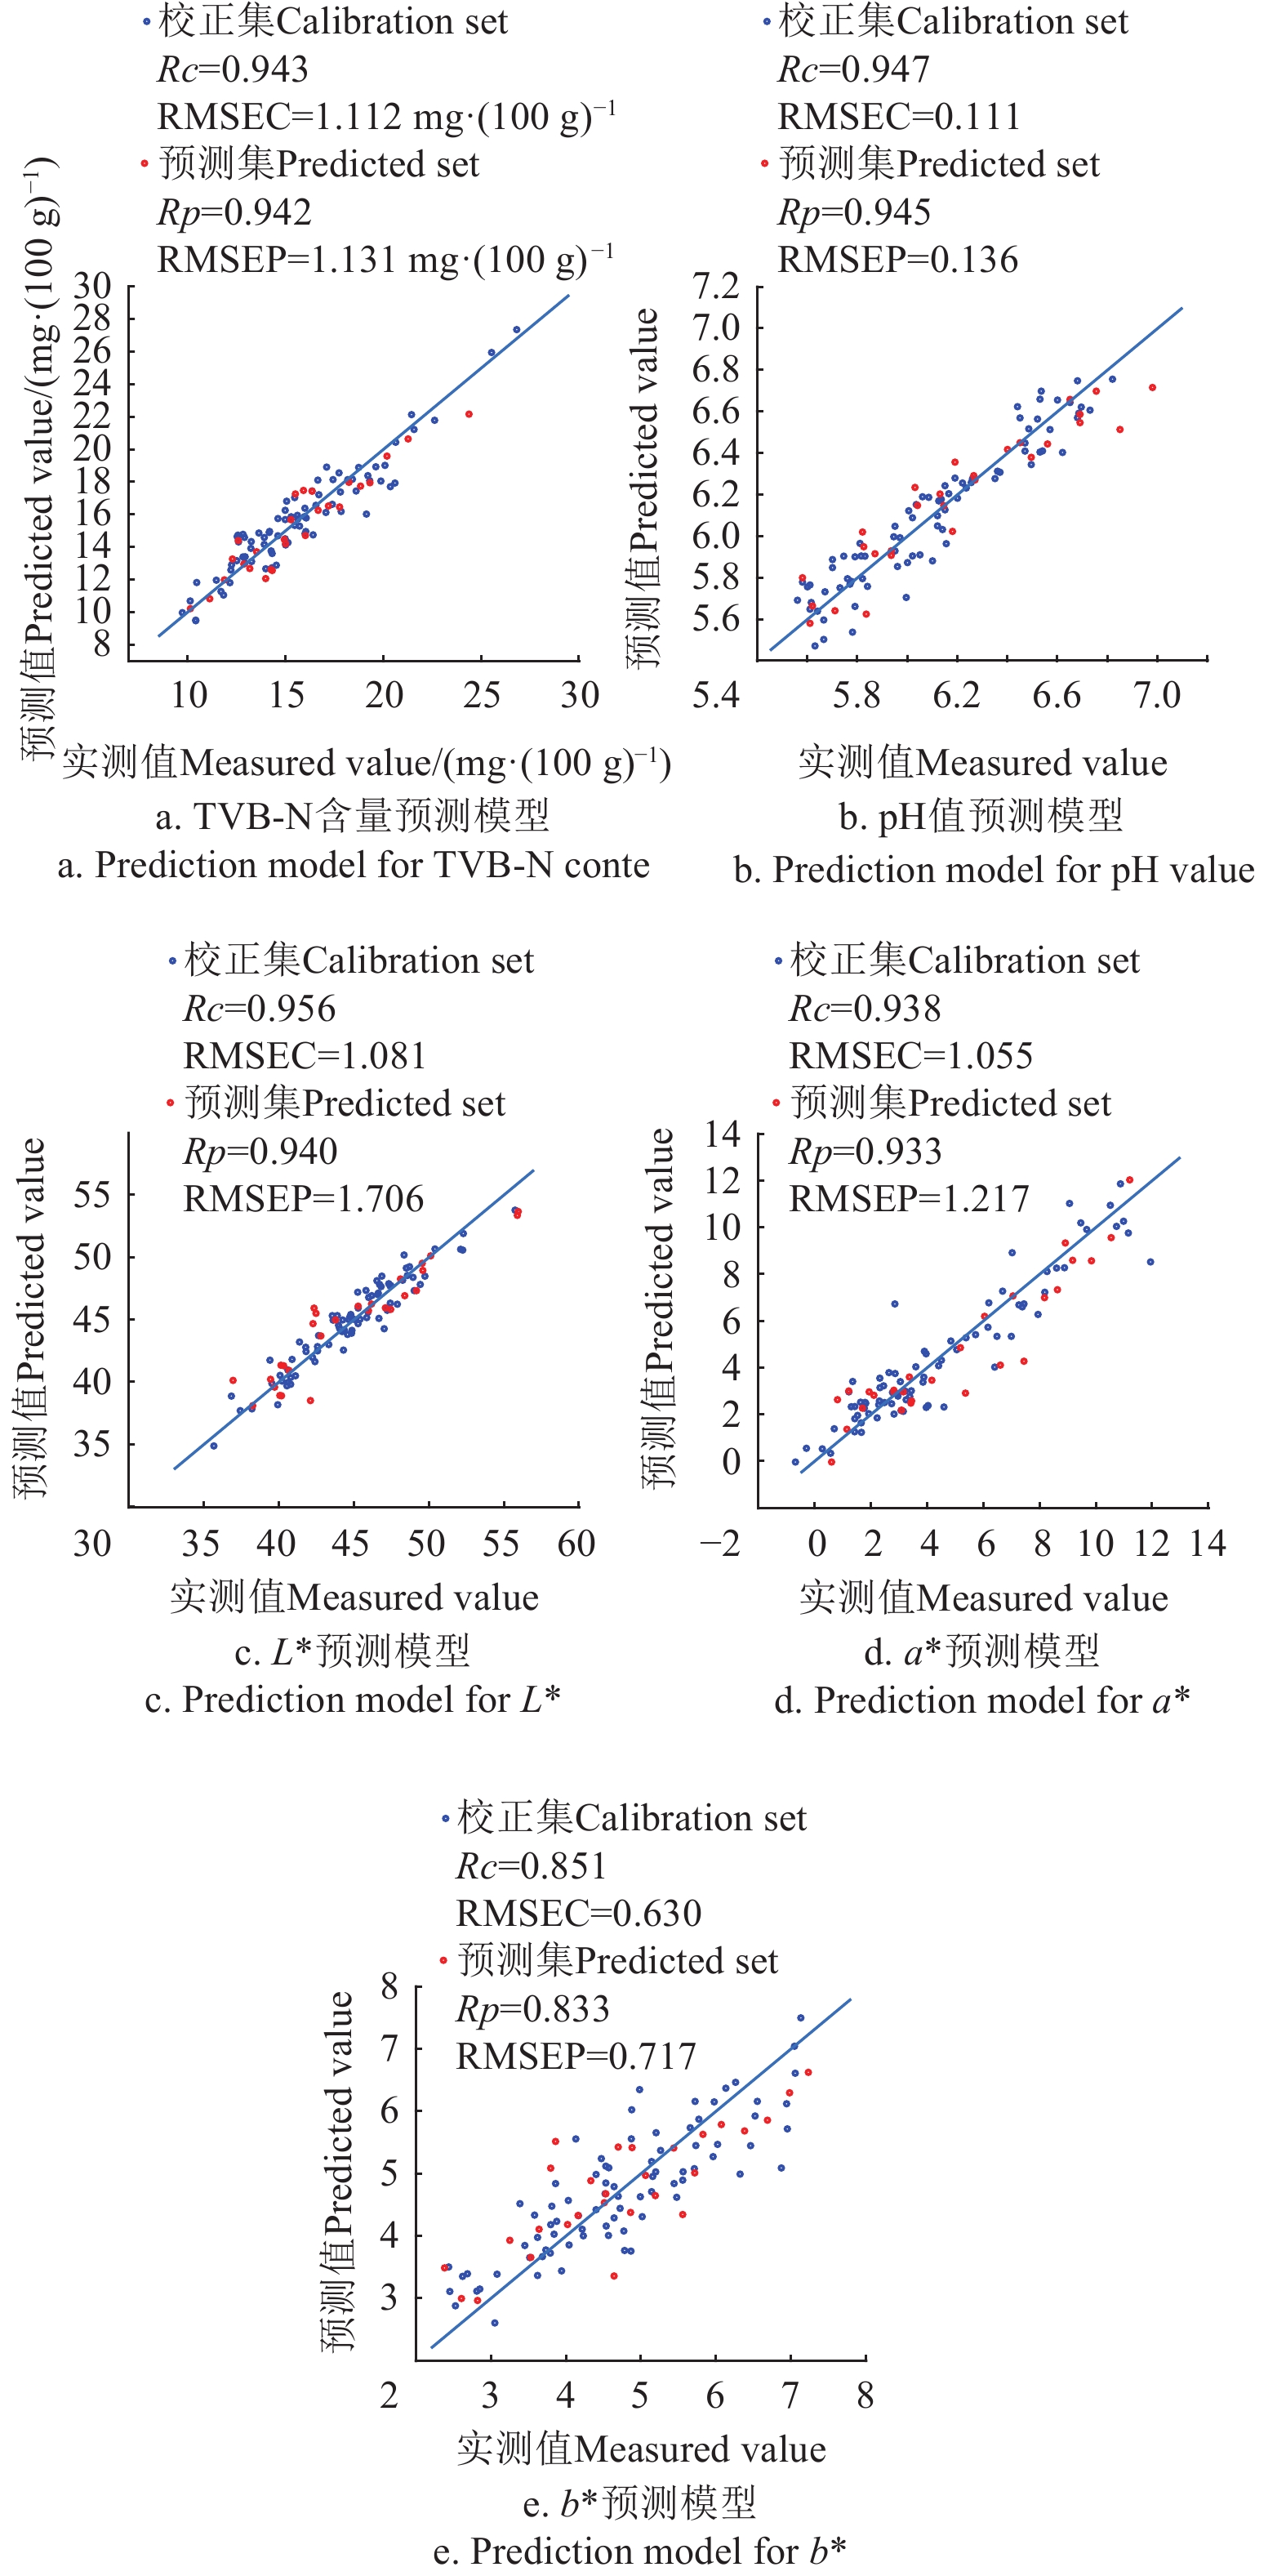
为实现储运过程中生鲜猪肉新鲜度实时检测,该研究基于可见/近红外光谱技术开发了掌上式生鲜猪肉新鲜度无损智能检测装置。检测装置以可见\近红外光谱采集单元为核心,搭建了硬件系统,开发了生鲜猪肉新鲜度多指标同时检测和新鲜度分级软件系统。通过研发的检测装置采集了不同部位猪肉的650~1 100 nm波长范围的漫反射光谱,经过标准正态变量变换(standard normal variable transformation,SNV)预处理后,对比连续投影算法(successive projections algorithm, SPA)和竞争性自适应加权抽样算法(competitive adaptive reweighted sampling, CARS)算法优选了猪肉新鲜度特征光谱,分别建立了不同部位猪肉新鲜度指标通用预测模型,并根据挥发性盐基氮(total volatile basic nitrogen,TVB-N)含量和pH值预测值,将猪肉分为新鲜、次新鲜和变质3个等级。试验结果表明,通过 SNV预处理和CARS算法筛选特征波长后建立的PLS预测模型(下文简称“SNV-CARS-PLS”)具有更好的性能, TVB-N含量、pH值、亮度L*、红度a*和黄度b*通用预测模型的预测集相关系数分别为0.942、0.945、0.940、0.933和0.833,预测均方根误差分别为1.131 mg/100 g、0.136、1.706、1.217和0.717。将通用检测模型导入检测装置进行了试验验证,对不同部位猪肉样本试验结果表明,TVB-N含量、pH值、亮度L*、红度a*和黄度b*的预测结果与理化值的均方根误差分别为1.109 mg/100 g、0.134、1.140、1.094和0.636;新鲜度的分级正确率为92.86%;单个样品检测时间约为1 s。该检测装置可满足不同部位猪肉新鲜度多指标现场快速检测和分级的需求,为及时掌握储运过程中生鲜猪肉新鲜度情况、辅助决策储运和销售方案、保障生鲜猪肉品质安全具有重要作用。
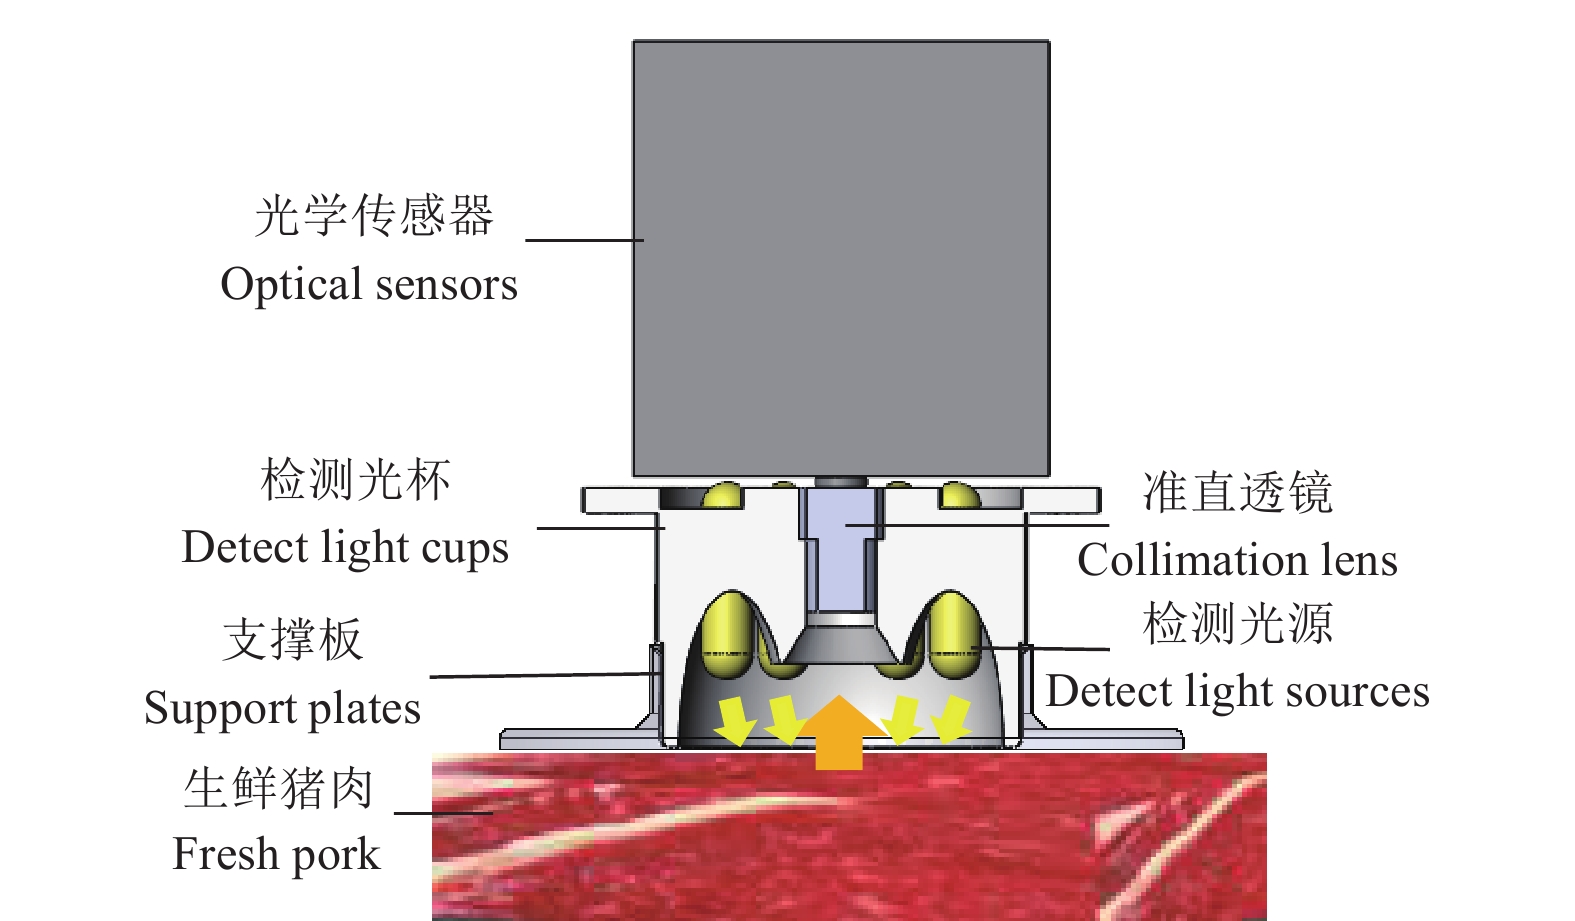
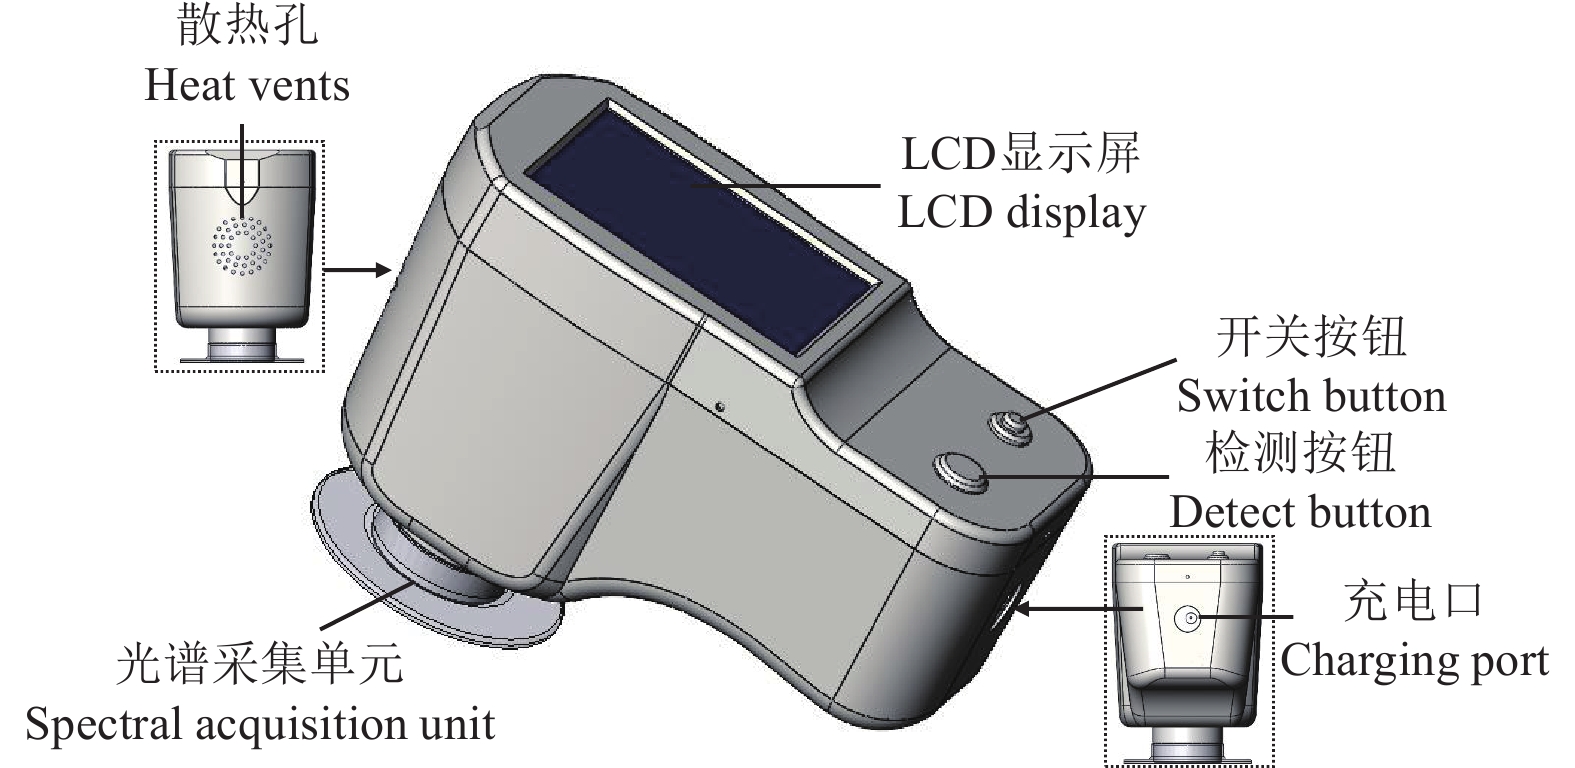
Abstract:China is the world's largest producer and consumer of fresh pork, but in the production and sales of pork, fresh pork is very prone to spoilage. In order to realize the real-time detection of fresh pork freshness during storage and transportation, this study developed a handheld fresh pork freshness non-destructive intelligent detection and grading device based on visible/near-infrared spectroscopy. The detection device took the visible/near-infrared spectrum acquisition unit as the core, built a hardware system, and developed a software system for simultaneous detection of fresh pork freshness and freshness grading. The detection device mainly consists of a power supply, central controller, display unit, heat dissipation unit, detection light source and spectral sensor. The spectral sensor and detection light source are integrated with a visible/near-infrared spectral acquisition unit by the detection probe. The spectral acquisition unit transmits the diffuse reflectance spectral signal of pork to the central controller for processing and analysis. Through the display unit and control buttons, human-computer interaction operation, real-time control and result display can be achieved. According to the selection of each component and the actual application scenario, the whole machine structure was designed, the size of the whole machine is only 165 mm×75 mm×115 mm, the weight is 745 g, and it can be held by one person and completed the detection with one button. Through the developed device, the diffuse reflection spectrum of pork in the wavelength range of 650-1 100 nm was collected. After the spectra were preprocessed by standard normal variable transformation (SNV), the continuous projection algorithm (SPA) and the competitive adaptive weighted sampling algorithm (CARS) algorithm were compared, and the general prediction model of pork freshness index in different parts was established. According to the predicted value of volatile salt-based nitrogen (TVB-N) content and pH, pork was divided into three grades: fresh, sub-fresh and spoilage. The experimental results show that the prediction model established by SNV-CARS-PLS has better performance. The prediction set correlation coefficients of TVB-N content, pH, L*, a* and b* were 0.942, 0.945, 0.940, 0.933 and 0.833, respectively. And the prediction root mean square errors were 1.131 mg/100 g, 0.136, 1.706, 1.217 and 0.717, respectively. The results of the general detection model were introduced into the device and verified by experiments, and the test results showed that the prediction results of root mean square errors of TVB-N content, pH, L*, a* and b* were 1.109 mg/100 g, 0.134, 1.140, 1.094 and 0.636, respectively. The correct grading rate of freshness was 92.86%. The detection time for a single sample was about 1 s. Research has shown that the detection device can meet the needs of multi-index on-site rapid detection and grading of pork freshness of different parts, with advantages such as low cost, portability, simple operation, and efficiency. It is suitable for various links in the supply chain of pork and providing guidance for production and consumption decision-making. The detection also plays an important role in timely grasping the freshness of fresh pork in the process of storage and transportation, assisting in decision-making storage, transportation and sales plans, and ensuring the quality and safety of fresh pork.
-
0. 引 言
随着农业装备不断向现代化、智能化和规模化发展[1],工业机器人的应用范围扩展至农业装备领域是必然趋势。旋转矢量(rotate vector,RV)减速器具有体积小、传动比范围大、质量轻、精度保持稳定、效率高等特点,农业机械经常需要大比例减速的情况,常选用RV减速器[2]。RV减速器作为农业机器人及农业机械的核心传动部件,其健康状况直接决定了传动精度、可靠性、生产效率和农机寿命。然而,由于RV减速器结构复杂,且在实际工作中工况多变,作业环境恶劣,随时发生故障[3]。RV减速器故障严重时会导致生产停滞,造成巨大的经济损失。因此,研究农业机器人RV减速器的故障诊断方法,及早发现并处理故障,缩短维护时间,对保障机器人安全运行、提高企业生产效率和经济效益具有重大意义。
振动信号能够有效反映部件的健康状态,在故障诊断中得到广泛应用[4]。近年来,许多学者对此开展了研究,提出了神经网络[5]、深度学习[6]、时频分析[7]、盲反卷积[8]等方法。汪久根等[9]采用残差网络提高了RV减速器不同故障的分类准确率。YIN等[10]开发了一种基于知识和数据双驱动的传输网络用于RV减速器故障诊断。彭鹏等[11]提出了一种抗干扰的 RV 减速器故障识别卷积神经网络模型。韩特等[12]在深度特征嵌入空间下构建特征图,通过标签传播算法生成伪标签,利用信息熵评估健康状态概率的分布。上述关于RV减速器的故障诊断精度较高,主要采用神经网络、深度学习、机械学习等算法,但是此类算法的实现需要大量不同类型的数据支撑。而基于时域、频域或时频域的分析方法能够在少量数据的支撑下完成故障诊断。XIE等[13]提出了一种基于电流信号的瞬时频率趋势图与参数自适应变分模态分解算法相结合的RV减速器故障诊断方法,实现了RV减速器太阳轮故障特征提取。GUO等[14]将计算阶跟踪和同步平均相结合识别了RV减速器行星齿轮齿根裂纹故障。雷亚国等[15]利用脊线提取完成RV减速器振动信号的平稳数据截取,有效提取了RV减速器行星轮的故障信息。由于RV减速器因润滑、制造误差和不合理受力会引起各种机械故障,使得实际运行中裂纹、点蚀等故障往往同时或先后出现,传感器采集的信号往往是多个故障源相互耦合的结果,使故障诊断变得非常困难。文献[13-15]提出的故障诊断方法适于单一故障诊断,对RV减速器复合故障检测能力下降甚至失效。因此,如何在复合故障相互耦合以及往复运动、时变转速工况下,精确分离提取耦合故障特征是RV减速器故障诊断领域亟待攻克的难题。盲源分离(blind source separation,BSS)技术可以在传输通道未知的情况下,从混合信号中把多个信号源分离出来。独立成分分析(independent component analysis,ICA) [16]和稀疏分量分析(sparse component analysis,SCA) [17] 是常用的以信号处理技术求解BSS问题。ICA算法的前提是源信号是统计独立的,且每个独立分量必须符合非高斯分布。而现代机械设备难以满足统计独立性的假设,但SCA方法的稀疏性假设相对容易满足。
SCA算法中,聚类方法是混合矩阵估计的首选。WANG等[18]提出了一种两阶段的聚类算法,从而提高了混合矩阵的估计精度。NORSALINA等[19]引入自适应时频阈值提高混合矩阵估计的精度。DING等[20]利用同步压缩S变换估计含谐波传输阻抗的混合矩阵。密度峰值聚类算法(density peak clustering,DPC)考虑局部密度和相对距离绘制决策图,快速识别簇中心并完成聚类。 DPC具有唯一输入参数,无需先验知识和迭代[21]。在解决振动源数目估计方面有一定的潜力。SCA算法还包括了源信号的恢复,主流方法有两类:一是通过优化逼近L0范数的函数恢复源信号。BU等[22]使用光滑的连续函数来近似L0范数。ZHANG等[23]用复三角函数逼近L0范数。但是上述方法具有源信号射入方向越近恢复精度越低。二是压缩感知(compressed sensing,CS)重构算法[24],该方法使用L1范数优化取代L0范数优化恢复源信号,避免了L0范数优化的NP-Hard问题。正交匹配追踪算法(orthogonal matching pursuit,OMP)克服匹配追踪算法的缺陷,在算法迭代过程中,残差能够与已经选择的原子正交,保证相同索引不会被重复选择,迭代过程在有限的次数内收敛[25],在重构信号算法的研究中发挥了重要作用。
结合上述分析,本文提出一种基于时频图像脊线提取与改进稀疏分量分析相结合的RV减速器复合故障盲提取方法,旨在实现往复运动、时变转速、故障源数目未知工况下的RV减速器复合故障诊断。首先使用时频图像脊线提取(ridge extraction from time-frequency images,RETF)从时频图中提取脊线,完成对平稳信号的同步截取,然后利用sinC函数改进形态滤波(sinC-morphological filtering,SMF)、DPC和OPM相结合的盲源分离方法(SMF-DPC-OMP)实现平稳信号复合故障的分离提取,采用SMF对观测信号进行滤波降噪处理,在提高信噪比的同时突出信号的冲击分量,并对滤波后的信号进行密度峰值聚类处理,得到聚类中心,构建传感矩阵;接着将滤波后的信号转换到频域以满足SCA的稀疏性要求;最后利用OMP算法在频域重构源信号,在提高计算速度和适应性的同时,实现复合故障特征的提取。
1. 盲分离的数学模型
盲源分离是指在源信号和信号传输通道均未知的情况下,仅依赖传感器拾取的观测信号恢复和估计源信号的技术[26]。含噪声SCA的数学模型为
{{\boldsymbol{X}}_{m \times t}} = {{\boldsymbol{A}}_{m \times n}}{{\boldsymbol{S}}_{n \times t}} + {{\boldsymbol{V}}_{m \times t}} (1) 式中 {\boldsymbol{X}} 为观测矩阵,即采集到的振动信号; {\boldsymbol{A}} 为混合矩阵; {\boldsymbol{S}} 是具有稀疏性的未知源信号; {\boldsymbol{V}} 为噪声或其他随机干扰成分; m 为传感器数量; n 为源信号数量; t 为观测时间,s。
2. 基于时频图像的脊线提取
短时傅里叶变换(short-time fourier transform,STFT)是有效捕获时变频率的方法之一,其定义为[27]
Q\left( {t,f} \right) = \int\limits_R {x\left( \tau \right){h_\sigma }\left( {\tau - t} \right){{\text{e}}^{ - {j}_0 2{\text{π }}f\tau }}{\text{d}}\tau } (2) 式中x\left( \tau \right) 为多分量信号;Q\left( {t,f} \right)是信号的时频表达(time frequency representation,TFR);{h_\sigma }\left( {\tau - t} \right)是长度为\tau 的高斯窗;R为实数集;t为时间;f为频率;j表示复数。
从TFR中提取时频脊线估计瞬时频率(instantaneous frequency,IF)是完全非参数的,并且能适应不同的情况。有效的脊线提取方法是寻找TFR的最大位置[27],其定义如下:
\overline {{D}} (t) = \mathop {\arg \max }\limits_{f \in J} \left| {Q(t,f)} \right|,{\kern 1pt} {\kern 1pt} {\kern 1pt} {\kern 1pt} t = {t_0}, \ldots ,{t_{N - 1}} (3) 式中 \overline {{D}} (t) 表示得到的脊线,是理论 {{D}}(t) 的估计, J 是频率的集合,N 为信号截止时间。RETF算法的具体实现步骤如下:
1)初始化参数,并创建一个预存矩阵{{\boldsymbol{K}}_i};
2)对时域信号x\left( t \right)进行STFT变换,得到其时频分布Q\left( {t,f} \right);
3)寻找并标记最大能量点\left[ \begin{gathered} {t_0} \\ {f_0} \\ \end{gathered} \right],将该点存储为{\boldsymbol{K}}矩阵的第一列;
4)使Q\left( {{t_0},f} \right)在最大值点{t_0}附近时刻归0,即Q\left( {{t_0},f} \right) = 0,f \in \left[ {{f_0} - \Delta f,{f_0} + \Delta f} \right],其中\Delta f为滤波带宽惩罚参数,控制滤波带宽;
5)在Q\left( {{t_0},f} \right)的邻域内寻找下一个最大能量点 \left[ \begin{gathered} t_{0}' \\ f_{0}' \\ \end{gathered} \right] = \ {\mathrm{\max}} _{\left( {{t_\alpha },{f_\alpha }} \right)}Q\left( {t,f} \right) 。 {t_\alpha } \in \left[ {{t_0} - 1,{t_0} + 1} \right] ,{f_\alpha } \in \left[ {f_0} -F,{f_0} + F \right],H为选定的窗参数,控制迭代中 \overline {{D}} (t) 增量的平滑程度,H越小, \overline {{D}} (t) 增量越平滑;
6)将 \left[ \begin{gathered} t_0' \\ f_0' \\ \end{gathered} \right] 存储为{\boldsymbol{K}}矩阵的下一列;
7)使Q\left( {t_0',f} \right)在最大值点t_0'附近时刻归0,即Q\left( {t_0',f} \right) = 0,f \in \left[ {{f_0} - \Delta f,{f_0} + \Delta f} \right];
8)如果时间指标{t_\alpha }和频率指标{f_\alpha }未达到TFR矩阵的边界,返回步骤5);否则返回步骤1),并创建一个新的预存矩阵{{\boldsymbol{K}}_{i + 1}};
9)当剩余TFR能量小于阈值\varepsilon 时停止算法(每一个预存矩阵,即是一条时频脊线)。
3. 基于SMF-DPC-OMP的盲源分离
3.1 基于\sin C函数的改进形态滤波降噪
3.1.1 构建\sin C结构元素
\sin C函数又称辛格函数,定义如下:
\sin C\left( x \right) = \frac{{\sin \left( {{\text{π}}x} \right)}}{{{\text{π}}x}} (4) 本文选取 \sin C 函数作为结构元素时主要定义长度L和主瓣比p。长度是指整个图像的长度,主瓣比是指从中间截取整个图像的百分比。图1为L = 20、 p = 50\text{%} 的 {\mathrm{sin}} C 结构元素。
3.1.2 构建平均组合滤波器
形态滤波器的构建主要包括结构元素和形态算子。结构元素的选择包括结构元素的形状、长度、高度(振幅)等。在处理一维信号时 ,结构元素的形状一般有线形、三角形、半圆形、正弦等,本文选择 sin C函数作为结构元素 ,结合形态算子腐蚀Θ、膨胀\oplus 、形态开○和形态闭●,构建基于sinC函数的SMF平均组合滤波器。
设原信号f\left( n \right)和结构元素g\left( m \right)为分别定义在F\left( {1,2, \ldots ,n - 1} \right)和G = \left( {1,2, \ldots, m - 1} \right)上的离散函数, N \geqslant M。则f\left( n \right)关于g\left( m \right)的腐蚀运算、膨胀运算、开运算和闭运算[28]分别为
(f\Theta g)(n) = \min[f(n + m) - g(m)] (5) (f \oplus g)(n) = \max [f(n - m) + g(m)] (6) (f \circ g){\kern 1pt} (n) = (f\Theta g \oplus g)(n) (7) (f \bullet g){\kern 1pt} (n) = (f \oplus g\Theta g)(n) (8) 通常使用形态开和形态闭的级联形式去除信号中的正、负噪声。TANG[28]为了去除信号中的正、负噪声,定义了形态闭-开(closing-opening,CO)和开-闭(opening-closing,OC)滤波器:
{\mathrm{CO}}{\kern 1pt} (f(n)) = (f \bullet g \circ g)(n) (9) {\mathrm{OC}}{\kern 1pt} (f(n)) = (f \circ g \bullet g)(n) (10) 为了抑制统计偏倚,本文采用结合OC和CO的平均组合滤波器[28]:
y(n) = [{\mathrm{OC}}(f(n) + {\mathrm{CO}}(f(n)]/2 (11) 3.1.3 基于\sin C的平均组合滤波器效果验证
为了验证基于{\mathrm{sin}}\; C 函数的SMF滤波效果,生成模拟轴承外圈故障的仿真信号并添加信噪比(signal-to-noise ratio,SNR)为−3 dB的白噪声。图2为含噪声的仿真信号及滤波后的时域波形图,SMF降噪后的信噪比为0.7 dB,说明SMF较好的滤除干扰噪声,突显了信号的冲击特性。
将本文的SMF滤波器与文献[29]中的直线型滤波器(幅值为0,长度为10)进行对比,滤波器参数及滤波效果如图3所示。分析图3可知无论滤波器的参数如何选择,SMF的滤波后的信噪比总是要优于直线型滤波器。
3.2 基于DPC-OMP的盲源分离
3.2.1 DPC理论
DPC算法主要基于2个假设:1)聚类中心周围是低密度的点;2)聚类中心与密度较高的样本点之间的距离较大。设数据集U{{ = }}\left\{ {{u_1},{u_2}, \cdots, {u_R}} \right\}, {u_i}{{ = }}{\left( {{u_{i1}},{u_{i2}}, \cdots, {u_{io}}} \right)^{\mathrm{T}}} ,其中i = 1,2, \cdots ,R,{u_{ij}}表示数据点i的j维属性,j = 1,2, \cdots ,O;R为总体样本数。
1)计算局部密度\rho
对于每个数据点{u_i},i = 1,2, \cdots ,R,局部密度{\rho _i}可以被认为是距离点{u_i}较近的点的数量,{\rho _i}的定义如下[30]:
{\rho _i} = \sum\limits_{j,j \ne i} {\chi \left( {{d_{ij}} - {d_c}} \right)} (12) 式中\chi \left( x \right)为分段函数,x < 0时,\chi \left( x \right){\text{ = }}1,否则\chi \left( x \right){\text{ = 0}};{d_{ij}}表示i和j之间的距离(通常为欧氏距离),{d_c}表示截断距离。
2)计算最近邻距离\delta
每个点的最近邻距离{\delta _i} 为
{\delta _i} = \left\{ \begin{gathered} \mathop {\min \left( {{d_{ij}}} \right)}\limits_{j:{\rho_j} > {\rho_i}} ,{\kern 1pt} {\kern 1pt} {\kern 1pt} {\kern 1pt} {\kern 1pt} {\kern 1pt} {\kern 1pt} {\kern 1pt} {\kern 1pt} {\kern 1pt} {\kern 1pt} {\rho _i} < \max \left( \rho \right) \\ \mathop {\max \left( {{d_{ij}}} \right)}\limits_j ,{\kern 1pt} {\kern 1pt} {\kern 1pt} {\kern 1pt} {\kern 1pt} {\kern 1pt} {\kern 1pt} {\kern 1pt} {\kern 1pt} {\kern 1pt} {\kern 1pt} {\rho _i} = \max \left( \rho \right) \\ \end{gathered} \right. (13) 对于密度较低的样本点,计算该样本点与高于其密度的最近样本点之间的距离;而对于密度最高的样本点,则计算该点与最远样本点之间的距离。
3)选取聚类中心 V
聚类中心定义为同时具有高密度{\rho _i}和较大距离{\delta _i}的点{x_i},令{V_i} = {\rho _i}{\delta _i},取 V > \dfrac{2}{N}\displaystyle\sum\limits_{i = 1}^N {{V_i}} 为聚类中心。由于聚类对象为RV故障信号,{V_i}大多为0。为保证不遗漏正确的聚类中心,因此选取大于均值2倍的数据点为聚类中心。
3.2.2 压缩感知重构算法
利用压缩感知重构算法中的OMP算法对源信号进行重构。将 m 个长度为 t 的观测信号表示为 {\boldsymbol{y}} = ({y_{11}}, {y_{12}}, \cdots {y_{1\;t}}, \cdots ,{y_{m1}},{y_{m2}}, \cdots {y_{mt}})^{\mathrm{T}} 。
利用聚类中心 {\boldsymbol{V}}(m \times n) 构造传感矩阵 {\boldsymbol{W}} 。根据压缩感知模型,当混合信号长度为 mt \times 1 ,其传感矩阵 {\boldsymbol{W}} 的长度为 mt \times nt 。利用傅里叶变换正交矩阵 {{\boldsymbol{E}}_{t \times t}} 扩充矩阵 {\boldsymbol{V}} 的元素值,变换关系为 {{\boldsymbol{B}}_{ij}} = {{\boldsymbol{E}}_{t \times t}}{{\boldsymbol{V}}_{ij}} ,具体变换如式(14)所示。
{\boldsymbol{y}} = \left[ \begin{gathered} {{\boldsymbol{{\boldsymbol{B}}}}_{11}}{\kern 1pt} {\kern 1pt} {\kern 1pt} {\kern 1pt} {{\boldsymbol{B}}_{12}}{\kern 1pt} {\kern 1pt} {\kern 1pt} {\kern 1pt} \cdots {\kern 1pt} {\kern 1pt} {\kern 1pt} {\kern 1pt} {{\boldsymbol{B}}_{1n}} \\ {{\boldsymbol{B}}_{21}}{\kern 1pt} {\kern 1pt} {\kern 1pt} {\kern 1pt} {{\boldsymbol{B}}_{21}}{\kern 1pt} {\kern 1pt} {\kern 1pt} {\kern 1pt} \cdots {\kern 1pt} {\kern 1pt} {\kern 1pt} {\kern 1pt} {{\boldsymbol{B}}_{2n}} \\ {\kern 1pt} {\kern 1pt} {\kern 1pt} {\kern 1pt} {\kern 1pt} {\kern 1pt} \vdots {\kern 1pt} {\kern 1pt} {\kern 1pt} {\kern 1pt} {\kern 1pt} {\kern 1pt} {\kern 1pt} {\kern 1pt} {\kern 1pt} {\kern 1pt} {\kern 1pt} {\kern 1pt} {\kern 1pt} {\kern 1pt} {\kern 1pt} \vdots {\kern 1pt} {\kern 1pt} {\kern 1pt} {\kern 1pt} {\kern 1pt} {\kern 1pt} {\kern 1pt} {\kern 1pt} {\kern 1pt} {\kern 1pt} {\kern 1pt} {\kern 1pt} {\kern 1pt} {\kern 1pt} {\kern 1pt} {\kern 1pt} {\kern 1pt} \vdots {\kern 1pt} {\kern 1pt} {\kern 1pt} {\kern 1pt} {\kern 1pt} {\kern 1pt} {\kern 1pt} {\kern 1pt} {\kern 1pt} {\kern 1pt} {\kern 1pt} {\kern 1pt} {\kern 1pt} \vdots \\ {{\boldsymbol{B}}_{m1}}{\kern 1pt} {\kern 1pt} {\kern 1pt} {\kern 1pt} {{\boldsymbol{B}}_{m2}}{\kern 1pt} {\kern 1pt} {\kern 1pt} {\kern 1pt} \cdots {\kern 1pt} {\kern 1pt} {\kern 1pt} {\kern 1pt} {{\boldsymbol{B}}_{mn}} \\ \end{gathered} \right]{\boldsymbol{x}} (14) {\boldsymbol{x}} = {({x_{11}},{x_{12}}, \cdots ,{x_{1\;t}}, \cdots ,{x_{n1}},{x_{n2}}, \cdots ,{x_{nt}})^{\mathrm{T}}} 的长度是 (nt \times 1) 。至此,盲源分离的重构模型构建完成。
OMP是一种常用的压缩感知重构算法。首先在每次迭代过程中对所有选定的原子进行Schmidt正交化,以确保每次迭代的结果都是最优解。利用OMP算法进行重构的核心思想是构造频域感知矩阵。具体算法步骤如下:
1)初始化残差 {r_0} ,迭代次数 \ell ,傅立叶正交变换矩阵 {{\boldsymbol{E}}_{t \times t}} ,并根据 {{\boldsymbol{B}}_{ij}} = {{\boldsymbol{E}}_{t \times t}}{{\boldsymbol{V}}_{ij}} 构造传感矩阵 {\boldsymbol{W}}{\kern 1pt} {\kern 1pt} {\text{ = }}{\kern 1pt} {\kern 1pt} {\kern 1pt} \left[ \begin{gathered} {{\boldsymbol{B}}_{11}}{\kern 1pt} {\kern 1pt} {\kern 1pt} {\kern 1pt} {{\boldsymbol{B}}_{12}}{\kern 1pt} {\kern 1pt} {\kern 1pt} {\kern 1pt} \cdots {\kern 1pt} {\kern 1pt} {\kern 1pt} {\kern 1pt} {\kern 1pt} {\kern 1pt} {{\boldsymbol{B}}_{1n}} \\ {{\boldsymbol{B}}_{21}}{\kern 1pt} {\kern 1pt} {\kern 1pt} {\kern 1pt} {{\boldsymbol{B}}_{21}}{\kern 1pt} {\kern 1pt} {\kern 1pt} {\kern 1pt} \cdots {\kern 1pt} {\kern 1pt} {\kern 1pt} {\kern 1pt} {\kern 1pt} {\kern 1pt} {{\boldsymbol{B}}_{2n}} \\ {\kern 1pt} {\kern 1pt} {\kern 1pt} {\kern 1pt} {\kern 1pt} {\kern 1pt} \vdots {\kern 1pt} {\kern 1pt} {\kern 1pt} {\kern 1pt} {\kern 1pt} {\kern 1pt} {\kern 1pt} {\kern 1pt} {\kern 1pt} {\kern 1pt} {\kern 1pt} {\kern 1pt} {\kern 1pt} {\kern 1pt} {\kern 1pt} \vdots {\kern 1pt} {\kern 1pt} {\kern 1pt} {\kern 1pt} {\kern 1pt} {\kern 1pt} {\kern 1pt} {\kern 1pt} {\kern 1pt} {\kern 1pt} {\kern 1pt} {\kern 1pt} {\kern 1pt} {\kern 1pt} {\kern 1pt} {\kern 1pt} {\kern 1pt} \vdots {\kern 1pt} {\kern 1pt} {\kern 1pt} {\kern 1pt} {\kern 1pt} {\kern 1pt} {\kern 1pt} {\kern 1pt} {\kern 1pt} {\kern 1pt} {\kern 1pt} {\kern 1pt} {\kern 1pt} \vdots \\ {{\boldsymbol{B}}_{m1}}{\kern 1pt} {\kern 1pt} {\kern 1pt} {\kern 1pt} {{\boldsymbol{B}}_{m2}}{\kern 1pt} {\kern 1pt} {\kern 1pt} {\kern 1pt} \cdots {\kern 1pt} {\kern 1pt} {\kern 1pt} {\kern 1pt} {{\boldsymbol{B}}_{mn}} \\ \end{gathered} \right] ;
2)使用内积法计算传感矩阵 {\boldsymbol{W}} 的列向量与残差{r_i}的投影系数,并记录最大投影系数相对应的位置 {{\boldsymbol{\beta}} _i} ,随后将最大投影系数所对应的传感矩阵 {\boldsymbol{W}} 的列置0;
3)使用最小二乘法计算本次迭代的重构信号的估计值 {x_i} = {({{\boldsymbol{\beta}} _i}^{\mathrm{T}} \cdot {{\boldsymbol{\beta}} _i})^{ - 1}} \cdot {{\boldsymbol{\beta}} _i}^{\mathrm{T}} \cdot {{\boldsymbol{r}}_i} ;
4)更新残差 {r_{i + 1}} = {r_i} - {x_i} ,并重复步骤2),直到迭代结束;
5)使用 {E_{t \times t}} 做逆傅立叶变换得到维数为 (kt \times 1) 的时域信号 x ,并根据聚类中心的维数k,将维数为 (kt \times 1) 的时域信号 x 分割为k个维数为\left( {t \times 1} \right)的时域信号,从而完成信号的盲源分离。
3.3 本文算法总流程
1)平稳阶段截取:提取一组观测信号x\left( t \right)并进行STFT得到其时频表达Q\left( {t,f} \right)。随后提取时频脊线并截取恒速时段信号,获得平稳信号{x_1}\left( t \right);
2)信号预处理:构造基于 \sin C 结构元素的平均组合滤波器,并对平稳信号{x_1}\left( t \right)进行滤波降噪,得到滤波信号{x_2}\left( t \right);
3)估计混合矩阵:对滤波信号{x_2}\left( t \right)进行DPC得到聚类中心,即混合矩阵;
4)源信号重构:利用步骤3)的混合矩阵构造传感矩阵,使用OMP算法在频域重构源信号;
5)故障识别:对重构源信号进行快速傅里叶变换(fast Fourier transform,FFT)处理,根据分离信号频谱中的频率进行故障识别。
本文算法的总体流程图如图4所示。
4. 试验验证
4.1 试验介绍
试验信号来自于模拟农业机器人单关节臂往复运动的RV减速器试验台,如图5所示。将2个型号为333B30的PCB加速度传感器相互垂直安装于减速器保持架上拾取信号。水平方向为传感器1,垂直方向为传感器2。其中,试验台基座7上安装减速器保持架4,通过减速器保持架4装RV减速器5,型号为SV-X2MH100C-B2 LN的电机6输出轴通过RV减速器5连接关节臂1。图6为故障齿轮的实物图,图6a为太阳轮磨损图,图6b为行星轮磨损图。
![]() 图 5 试验台及传感器位置示意图1. 关节臂 2. 加速度传感器1 3. 加速度传感器2 4. 减速器保持架 5. RV减速器 6. 电机 7. 基座Figure 5. Diagram of position of test platform and sensor1. Articulated arm 2. Acceleration sensor 1 3. Acceleration sensor 2 4. Reducer cage 5. RV reducer 6. Motor 7. Test stand base
图 5 试验台及传感器位置示意图1. 关节臂 2. 加速度传感器1 3. 加速度传感器2 4. 减速器保持架 5. RV减速器 6. 电机 7. 基座Figure 5. Diagram of position of test platform and sensor1. Articulated arm 2. Acceleration sensor 1 3. Acceleration sensor 2 4. Reducer cage 5. RV reducer 6. Motor 7. Test stand base试验选用RV40E型减速器并以针轮固定的方式固定于试验台,减速比121、行星齿轮数目为2,太阳轮齿数{Z_1} = 12,行星轮齿数{Z_2} = 42,摆线轮齿数{Z_3} = 39,针轮齿数{Z_4} = 40。采集系统包括NI-USB9234采集卡与单向加速度传感器,采样频率为25.6 kHz。试验预设摆臂运动范围为0°~90°(单次抬升或下降90°),运行速度为100°/s。RV减速器的各个特征频率计算式见表1。
表 1 RV减速器各零件的工作频率Table 1. Working frequency of each part of RV reducer名称Name 计算公式Calculation formula 电机主轴转速
Motor spindle speed {n_1}/(r·min−1){n_1} = 60f/P 太阳轮转频
Sun gear rotation frequency {f_1}/Hz{f_1} = {n_1}/60 行星轮转频
Planetary gear rotation frequency {f_2}/Hz{f_2} = \dfrac{{{z_1}{z_4}}}{{({z_3} - {z_4})\left( {{z_1} + {z_2}{z_4}} \right)}}{f_1} 一级啮合频率
First stage engagement frequency {f_{1c}}/Hz{f_{1c}} = \dfrac{{{z_1}{z_2}{z_4}}}{{{z_1} + {z_2}{z_4}}}{f_1} 注:P为伺服电机磁极对数,{{\textit{z}}_1}为太阳轮齿数,{{\textit{z}}_2}为行星轮齿数,{{\textit{z}}_3} 为摆线轮齿数,{{\textit{z}}_4} 为针轮齿数。
Note: P is the number of magnetic poles of the servo moto, {{\textit{z}}_1} is the number of solar gear, {{\textit{z}}_2} is the number of planetary gear, {{\textit{z}}_3} is the number of cycloidal gear, and {{\textit{z}}_4} is the number of needle gear.行星轮故障频率{f_p}为行星轮相对于行星架的旋转频率,{f_p} = {f_2} - {f_3};太阳轮故障频率{f_s}为太阳轮相对于行星架的旋转频率,{f_s} = {f_1} + {f_3}。由于摆臂转速=100(°)/s =0.27 Hz,即支撑盘转频{f_3}=0.27 Hz。根据表1及太阳轮故障频率计算式计算可得太阳轮故障频率{f_s}为38.34 Hz,行星轮故障频率{f_p}为10.83 Hz。
4.2 试验信号分析
由传感器1和传感器2采集的2组信号都具有相同的运动状态,即同时加速或同时减速。因此本文在平稳阶段选取水平方向传感器1的振动信号用以分析机械臂的运动状态。图7为选取的振动信号进行STFT获得的时频图。可以看出,由于RV减速器的瞬时冲击过大,无法通过时频图区分出机械臂的3种运动状态,即启动加速阶段,恒速运动阶段以及减速停滞阶段。
时频图中的脊线对应时频域中能量最大的路径,可以近似看作设备瞬时频率的时频轨迹。对时频图进行脊线提取,结果如图8所示。分析脊线走势能够较为清楚地区分机械臂的不同运行阶段,包括启动加速阶段,平稳运行阶段以及减速停滞阶段(后续分析均为此阶段)。图9a为水平方向传感器1采集信号的时域波形,图9b为垂直方向传感器2采集信号的时域波形。图9时域波形体现了机械臂启动、平稳到停止整个工作过程幅值的变化。依据图8中脊线的平稳阶段区间,在图9中标注同步截取相应时段的时域振动信号(后续分析皆是截取后的振动信号)。
图10a为截取平稳阶段传感器1的信号波形,图10b为截取平稳阶段传感器2信号波形。对图10振动信号进行SMF处理,对图10振动信号进行SMF处理,传感器2的滤波前后的信号波形对比如图11所示,从图11b中能够观测到故障所导致的冲击更加明显。
![]() 图 9 基于时频脊线的传感器信号同步截取Figure 9. Synchronous sensor signal interception based on time-frequency ridge
图 9 基于时频脊线的传感器信号同步截取Figure 9. Synchronous sensor signal interception based on time-frequency ridge![]() 图 11 传感器2的滤波前后信号波形对比Figure 11. Comparison of signal waveforms of sensor 2 before and after filtering
图 11 传感器2的滤波前后信号波形对比Figure 11. Comparison of signal waveforms of sensor 2 before and after filtering对滤波后的信号进行包络谱分析,如图12所示,传感器1和传感器2滤波信号的频谱分别如图12a、12b所示。分析图12a、12b发现,太阳轮与行星轮的故障特征频率成分完全混合在一起,故障类型判断困难。
经SMF-DPC-OMP算法处理的频谱如图13所示,图13a的频率谱线集中在37.5 Hz及其倍频,与太阳轮理论计算故障频率38.34 Hz接近,故可推断图13a为太阳轮故障。图13b的频率谱线分布在10.94 Hz及其倍频,与行星轮理论计算故障频率10.83 Hz逼近,故识别其为行星轮故障。相比图12,图13中的频率混合现象已经完全被消除,说明本文方法可实现复合故障的完全分离。采用文献[29]提出的结合形态滤波与稀疏分量分析(MF-SCA)的盲分离算法进行对比进一步验证本文方法的有效性,结果如图14所示,分析可见,图14a、14b均存在太阳轮和行星轮故障特征频率,说明MF-SCA方法无法有效实现RV减速器复合故障的分离。与MF-SCA方法相比,SMF-DPC-OMP算法能够节省约75%的时间运行成本。
![]() 图 13 复合故障频谱SMF-DPC-OMP分离结果注:fs为太阳轮故障频率,fp为行星轮故障频率,Hz。Figure 13. Separation composite faults spectrum by SMF-DPC-OMPNote: fs is the Sun gear fourlty frequency, fp is the planetary gear fourlty frequency, Hz.
图 13 复合故障频谱SMF-DPC-OMP分离结果注:fs为太阳轮故障频率,fp为行星轮故障频率,Hz。Figure 13. Separation composite faults spectrum by SMF-DPC-OMPNote: fs is the Sun gear fourlty frequency, fp is the planetary gear fourlty frequency, Hz.5. 结 论
本文结合时频图像脊线提取、\sin C函数改进形态滤波和密度峰值聚类改进的稀疏分量分析各算法的优点,提出一种新的往复运动、变转速工况的RV减速器复合故障盲分离方法。通过RETE算法提取的脊线解决旋转机械变转速的问题,利用SMF-DPC-OMP实现了RV减速器复合故障的分离提取。试验台采集的RV减速器的太阳轮和行星轮磨损复合故障信号的分析结果显示,本文方法能够有效地完成复合故障的盲分离任务,主要结论如下:
1)RETE算法能够在变转速工况导致时频图较为模糊的情况下,识别出RV减速器的运动状态;
2)SMF-DPC-OMP算法能够在故障源数目未知的情况下,有效完成复合故障的盲分离任务;
3)与MF-SCA方法比较,SMF-DPC-OMP算法能够节省约75%的时间运行成本,使得频谱更为简洁,抑制精细侧频和干扰分量。
本文今后的工作将重点放在欠定条件下的故障提取上,或者进一步将该算法推广到旋转机械声信号的故障诊断中。
-
![]()
图 1 生鲜猪肉新鲜度检测装置工作原理图
Figure 1. Working principle diagram of fresh pork freshness detection device
![]()
图 2 可见/近红外光谱采集单元示意图
Figure 2. Schematic diagram of the visible/near-infrared spectral acquisition unit
![]()
图 3 掌上式生鲜猪肉新鲜度检测装置结构示意图
Figure 3. Schematic diagram of the structure of the handheld fresh pork freshness detection device
![]()
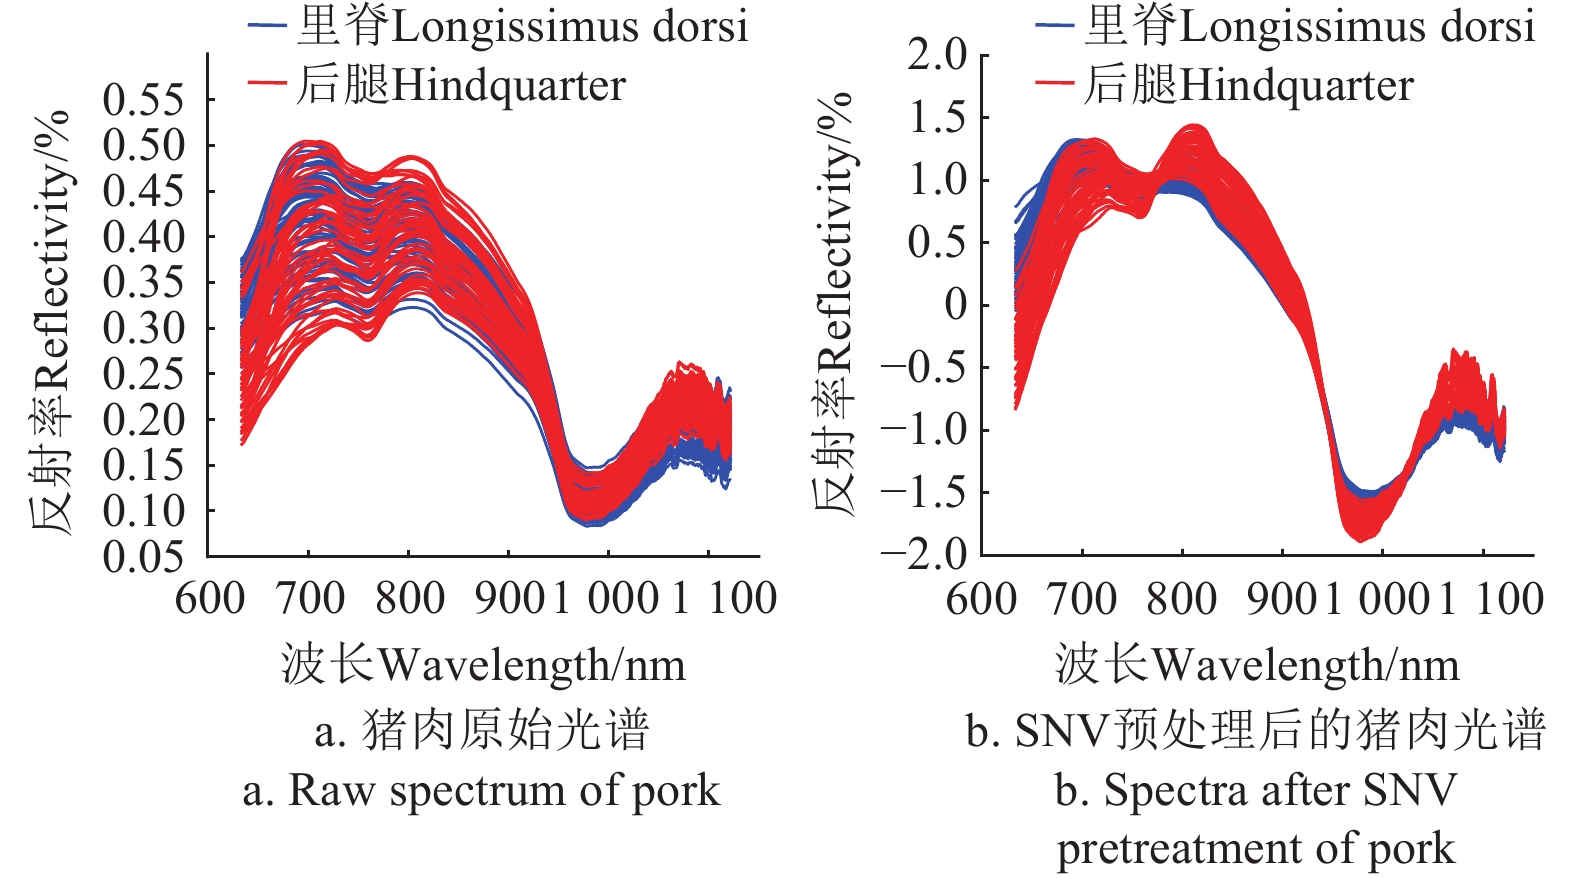
图 5 不同部位生鲜猪肉的可见/近红外光谱
Figure 5. Visible/near-infrared spectra of fresh pork at different parts
![]()
图 6 不同部位生鲜猪肉新鲜度指标理化值随储藏时间的变化
Figure 6. Changes of physical and chemical values of fresh pork freshness indexes in different parts with storage time
![]()
图 7 不同部位生鲜猪肉SNV-CARS-PLS模型预测散点图
Figure 7. SNV-CARS-PLS model for fresh pork in different parts predicts scatterplots
![]()
图 8 检测装置对生鲜猪肉新鲜度指标检测结果
Figure 8. Detection results of the fresh pork freshness index of the detection device
表 1 猪肉新鲜度分级
Table 1 Pork freshness grading
新鲜度指标
Freshness index新鲜
Fresh次新鲜
Sub-fresh变质
SpoilageTVB-N/(mg·(100 g)−1) TVB-N≤13 13<TVB-N<15 TVB-N≥15 pH值 pH value 5.45≤pH≤5.8 5.8<pH<6.2 pH≥6.2  下载: 导出CSV
表 2 不同变量选择算法的建模结果
Table 2 Modeling of differenrt variable selection methods
新鲜度指标
Freshness index建模方法
Modeling methods变量数
Variable No.校正集Calibration set 预测集Predicted set Rc RMSEC Rp RMSEP TVB-N PLS 774 0.871 1.575 mg·(100 g)−1 0.833 2.027 mg·(100 g)−1 CARS-PLS 44 0.943 1.112 mg·(100 g)−1 0.942 1.131 mg·(100 g)−1 SPA-PLS 26 0.880 1.593 mg·(100 g)−1 0.875 2.135 mg·(100 g)−1 pH PLS 774 0.916 0.145 0.856 0.172 CARS-PLS 25 0.947 0.111 0.945 0.136 SPA-PLS 20 0.901 0.143 0.884 0.154 L* PLS 774 0.929 1.388 0.914 2.028 CARS-PLS 31 0.956 1.081 0.940 1.706 SPA-PLS 23 0.929 1.528 0.920 1.649 a* PLS 774 0.938 1.054 0.910 1.424 CARS-PLS 20 0.938 1.055 0.933 1.217 SPA-PLS 10 0.923 1.304 0.910 1.463 b* PLS 774 0.842 0.659 0.838 0.665 CARS-PLS 18 0.851 0.630 0.833 0.717 SPA-PLS 8 0.854 0.782 0.710 0.953 注:Rc、RMSEC分别指校正集相关系数、均方根误差;Rp、RMSEP分别指预测集相关系数和均方根误差。下同。 Note: Rc and RMSEC refer to correlation coefficient and root mean square error of calibration set respectively; Rp and RMSEP refer to correlation coefficient and root mean square error of prediction set respectively. The same below.
下载: 导出CSV
表 3 生鲜猪肉新鲜度分级试验结果
Table 3 Results of fresh pork freshness grading test
等级
Grade正确个数
Number of correct错误个数
Number of errors正确率
Accuracy/%新鲜Fresh 19 2 92.86 次新鲜Sub-fresh 31 3 变质Spoilage 15 0
下载: 导出CSV
-
[1] 张晋豪,王浩东,邵良婷,等. 生鲜肉新鲜度新型快速表征技术研究进展[J]. 食品科学,2022,43(13):210-217. doi: 10.7506/spkx1002-6630-20210508-074 ZHANG Jinhao, WANG Haodong, SHAO Liangting, et al. Progress and trends in rapid novel technologies for characterization of fresh meat freshness: A review[J]. Food Science, 2022, 43(13): 210-217. (in Chinese with English abstract) doi: 10.7506/spkx1002-6630-20210508-074
[2] WANG J, SUN X, ZHANG H, et al. Dual-functional intelligent gelatin based packaging film for maintaining and monitoring the shrimp freshness[J]. Food Hydrocolloids, 2022, 124: 107258.
[3] WEI W, LI H, HARUNA S A, et al. Monitoring the freshness of pork during storage via near-infrared spectroscopy based on colorimetric sensor array coupled with efficient multivariable calibration[J]. Journal of Food Composition and Analysis, 2022, 113: 104726. doi: 10.1016/j.jfca.2022.104726
[4] 巫婷婷,赵书红,胡军勇,等. 猪肌肉颜色测定方法与结果表述的研究[J]. 河南农业科学,2018,47(10):125-129. doi: 10.15933/j.cnki.1004-3268.2018.10.023 WU Tingting, ZHAO Shuhong, HU Junyong, et al. Study on the determination method and results expression of meat color for pork[J]. Journal of Henan Agricultural Sciences, 2018, 47(10): 125-129. (in Chinese with English abstract) doi: 10.15933/j.cnki.1004-3268.2018.10.023
[5] 王伟,李敬,张军民,等. 基于光谱和色度信息的猪肉肉色研究[J]. 动物营养学报,2023,35(5):3342-3348. doi: 10.12418/CJAN2023.310 WANG Wei, LI Jing, ZHANG Junmin, et al. Research of pork color based on spectral and chromaticity information[J]. Chinese Journal of Animal Nutrition, 2023, 35(5): 3342-3348. (in Chinese with English abstract) doi: 10.12418/CJAN2023.310
[6] Dang D S, Buhler J F, Stafford C D, et al. Nix pro 2 and color muse as potential colorimeters for evaluating color in foods[J]. LWT-Food Science and Technology, 2021, 147(8): 111648.
[7] 中华人民共和国农业部. 猪肌肉品质测定技术规范: NY/T821-2004[S]. 北京:中国标准出版社,2004. [8] 陈韵,陈桂云,黎颖欣,等. 冻猪肉中挥发性盐基氮含量测定的不确定度评定[J]. 现代食品,2022,28(13):168-171. CHEN Yun, CHEN Guiyun, LI Yingxin, et al. Evaluation of uncertainty in determination of total volatile basic nitrogen in frozen pork by automatic kjeldahl apparatus method[J]. Modern Food, 2022, 28(13): 168-171. (in Chinese with English abstract)
[9] 王熬,凌育昕,司徒茵,等. 不同储存温度对猪肉中挥发性盐基氮本底值测定水平的影响[J]. 食品安全质量检测学报,2020,11(13):4285-4290. doi: 10.19812/j.cnki.jfsq11-5956/ts.2020.13.027 WANG Ao, LING Yuxin, SITU Yin, et al. Effect of different storage temperature on determination level of volatile basic nitrogen in pork[J]. Journal of Food Safety & Quality, 2020, 11(13): 4285-4290. (in Chinese with English abstract) doi: 10.19812/j.cnki.jfsq11-5956/ts.2020.13.027
[10] LI J, ZHANG N, YANG X, et al. RhB@MOF-5 composite film as a fluorescence sensor for detection of chilled pork freshness[J]. Biosensors, 2022, 12(7): 544 doi: 10.3390/bios12070544
[11] 张善娇. 基于O2O模式的生鲜农产品配送研究[J]. 中国储运,2023(3):52-53. ZHANG Shanjiao. Research on fresh agricultural products distribution based on O2O model[J]. China Storage& Tansport Magazine, 2023(3): 52-53. (in Chinese with English abstract)
[12] 刘小红,陈瑶生. 2022年生猪产业发展状况、未来发展趋势与建议[J]. 中国畜牧杂志,2023,59(3):264-268. doi: 10.19556/j.0258-7033.20230228-10 LIU Xiaohong, CHEN Yaosheng. Development status, future development trend and Suggestions of pig industry in 2022[J]. Chinese Journal of Animal Science, 2023, 59(3): 264-268. (in Chinese with English abstract) doi: 10.19556/j.0258-7033.20230228-10
[13] 王恒鹏,王引兰,姜松松,等. 不同干燥方式下调理猪肉干品质变化及其机制[J]. 农业工程学报,2021,37(24):317-326. WANG Hengpeng, WANG Yinlan, JIANG Songsong, et al. Quality changes and its mechanism of conditioned pork jerkys under different drying methods[J]. Transactions of the Chinese Society of Agricultural Engineering (Transactions of the CSAE), 2021, 37(24): 317-326.(in Chinese with English abstract)
[14] CHO J, KIM H J, KWON J S, et al. Effect of marination with black currant juice on the formation of biogenic amines in pork belly during refrigerated storage[J]. Korean Society for Food Science of Animal Resources, 2021,41 (5): 763-778.
[15] HU H , YONG H , YAO X ,et al. Effect of starch aldehyde-catechin conjugate composite coating on the quality and shelf life of fresh pork loins[J]. Journal of the Science of Food and Agriculture, 2022, 102(12): 5238-5249. doi: 10.1002/jsfa.11877
[16] SANTOS F D, VIANNA S G T, CUNHA P H P, et al. Characterization of crude oils with a portable NIR spectrometer[J]. Microchemical Journal, 2022, 181: 107696. doi: 10.1016/j.microc.2022.107696
[17] FLORIANA C, LUCA F, JERNEJ M, et al. Near-Infrared spectroscopy and machine learning for accurate dating of historical books[J]. Journal of the American Chemical Society, 2023, 145(22): 12305-12314. doi: 10.1021/jacs.3c02835
[18] KUCHA T C, NGADI O M. Rapid assessment of pork freshness using miniaturized NIR spectroscopy[J]. Journal of Food Measurement and Characterization, 2020, 14(2): 1105-1115. doi: 10.1007/s11694-019-00360-9
[19] YANNA R, MUHAMMAD Z, LIHUA L, et al. Application of portable Vis-NIR spectroscopy for rapid detection of myoglobin in frozen pork[J]. Meat Science, 2023, 201:109170.
[20] ARIAS E, SIERRA V, PRADO N, et al. Development of a portable near-infrared spectroscopy tool for detecting freshness of commercial packaged pork[J]. Foods, 2022, 11(23): 3808.
[21] 黄长平,朱欣然,张辰璐,等. 猪肉新鲜度光谱特征指数构建及敏感性分析[J]. 光谱学与光谱分析,2018,38(2):552-558. HUANG Changping, ZHU Xinran, ZHANG Chenlu, et al. Pork freshness spectral feature index: Development and sensitivity analysis[J]. Spectroscopy and Spectral Analysis, 2018, 38(2): 552-558. (in Chinese with English abstract)
[22] BALAGE J M , SILVA S D L E , GORNIDE C A ,et al. Predicting pork quality using Vis/NIR spectroscopy[J]. Meat Science, 2015, 108: 37-43. doi: 10.1016/j.meatsci.2015.04.018
[23] QU F F, REN D, HE Y, et al. Predicting pork freshness using multi-index statistical information fusion method based on near infrared spectroscopy[J]. Meat Science, 2018, 146: 59-67. doi: 10.1016/j.meatsci.2018.07.023
[24] PENG Y K, SUN H W, WANG W X , et al. Spectral detection techniques for non-destructively monitoringthe quality, safety, and classification of fresh red meat[J]. Food Analytical Methods, 2018, 11: 2707-2730. doi: 10.1007/s12161-018-1256-4
[25] 王文秀,彭彦昆,孙宏伟,等. 基于可见/近红外光谱生鲜肉多品质参数检测装置研发[J]. 农业工程学报,2016,32(23):290-296. WANG Wenxiu, PENG Yankun, SUN Hongwei, et al. Development of simultaneous detection device for multi-quality parameters of meat based on Vis/NIR spectroscopy[J]. Transactions of the Chinese Society of Agricultural Engineering (Transactions of the CSAE), 2016, 32(23): 290-296. (in Chinese with English abstract)
[26] MORAN L , ANDRES S , ALLEN P ,et al.Visible and near infrared spectroscopy as an authentication tool: Preliminary investigation of the prediction of the ageing time of beef steaks[J]. Meat Science, 2018, 142: 52-58. doi: 10.1016/j.meatsci.2018.04.007
[27] SONG S, CHENG H, JUNG E Y, et al. Muscle fiber characteristics on chop surface of pork loin (M. longissimus thoracis et lumborum) associated with muscle fiber pennation angle and their relationships with pork loin quality[J]. Food Science of Animal Resources, 2020, 40(6): 957. doi: 10.5851/kosfa.2020.e66
[28] DUAN S, TANG X, LI W, et al. Analysis of the differences in volatile organic compounds in different muscles of pork by GC-IMS[J]. Molecules, 2023, 28(4): 1726. doi: 10.3390/molecules28041726
[29] 刘超,张家瑜,戚超,等. 基于EfficientNet网络模型的猪肉新鲜度智能识别方法[J]. 食品科学:1-10[2023-10-24]. http://kns.cnki.net/kcms/detail/11.2206.TS.20230310.1503.028.html LIU Chao, ZHANG Jiayu, QI Chao, et al. Research on intelligent recognition method of pork freshness based on efficient net network model[J]. Food Science: 1-10[2023-10-24]. http://kns.cnki.net/kcms/detail/11.2206.TS.20230310.1503.028.html (in Chinese with English abstract)
[30] 郭志明,王郡艺,宋烨,等. 手持式可见近红外苹果品质无损检测系统设计与试验[J]. 农业工程学报,2021,37(22):271-277. GUO Zhiming, WANG Junyi, SONG Ye, et al. Design and experiment of the handheld visible-near infrared nondestructive detecting system for apple quality[J]. Transactions of the Chinese Society of Agricultural Engineering(Transactions of the CSAE), 2021, 37(22): 271-277. (in Chinese with English abstract)
[31] 王凡,赵春江,徐波,等. 便携式茶鲜叶品质光谱检测装置研制[J]. 农业工程学报,2020,36(24):273-280. WANG Fan, ZHAO Chunjiang, XU Bo, et al. Development of a portable detection device for the quality of fresh tea leaves using spectral technology[J]. Transactions of the Chinese Society of Agricultural Engineering(Transactions of the CSAE), 2020, 36(24): 273-280. (in Chinese with English abstract)
[32] BIAO Y, GUO W C, HUANG X L, et al. A portable, low-cost and sensor-based detector on sweetness and firmness grades of kiwifruit[J]. Computers and Electronics in Agriculture, 2020, 179: 105831. doi: 10.1016/j.compag.2020.105831
[33] WAN G, FAN S, LIU G, et al. Fusion of spectra and texture data of hyperspectral imaging for prediction of myoglobin content in nitrite-cured mutton[J]. Food Control, 2023, 144: 109332. doi: 10.1016/j.foodcont.2022.109332
[34] JU H, SUN D W. Hyperspectral imaging technology for rapid detection of various microbial contaminants in agricultural and food products[J]. Trends in Food Science & Technology, 2015, 46(1): 99-109.
[35] 王丽莎,王航,李侠,等. 不同部位猪肉肌纤维类型组成与品质特性比较研究[J]. 肉类研究,2020,34(6):1-7. doi: 10.7506/rlyj1001-8123-20200316-073 WANG Lisha, WANG Hang, LI Xia, et al. Comparison of muscle fiber traits and meat quality of different porcine skeletal muscles[J]. Meat Research, 2020, 34(6): 1-7. (in Chinese with English abstract) doi: 10.7506/rlyj1001-8123-20200316-073
[36] ZHUANG Q B, PENG Y K, YANG D Y, et al. Detection of frozen pork freshness by fluorescence hyperspectral image[J]. Journal of Food Engineering, 2022, 316: 110840.
[37] 何珂,罗秀芝,孙钦明,等. 基于气流与多点激光技术的牛肉新鲜度检测装置研发[J]. 农业工程学报,2021,37(21):278-286. HE Ke, LUO Xiuzhi, SUN Qinming, et al. Development of beef freshness detection device based on air flow and multi-point laser technique[J]. Transactions of the Chinese Society of Agricultural Engineering(Transactions of the CSAE), 2021, 37(21): 278-286. (in Chinese with English abstract)
[38] ZHUANG Q B, PENG Y K, YANG D Y, et al. UV-fluorescence imaging for real-time non-destructive monitoring of pork freshness[J]. Food Chemistry, 2022, 396: 133673.
[39] FAN Z, TONGHAI K, JIANFENG S, et al. Improving TVB-N prediction in pork using portable spectroscopy with just-in-time learning model updating method[J]. Meat Science, 2022, 188: 108801. doi: 10.1016/j.meatsci.2022.108801
[40] Gap-Don KIM, YANG Han-Sul, JEONG Jin-Yeon. Intramuscular variations of proteome and muscle fiber type distribution in semimembranosus and semitendinosus muscles associated with pork quality[J]. Food Chemistry, 2018, 244: 143-152. doi: 10.1016/j.foodchem.2017.10.046
[41] Gap-Don KIM, JEONG Jin-Yeon, YANG Han-Sul, et al. Differential abundance of proteome associated with intramuscular variation of meat quality in porcine longissimus thoracis et lumborum muscle[J]. Meat Science, 2019, 149: 85-95. doi: 10.1016/j.meatsci.2018.11.012
[42] DAMIAN Knecht, DUZIŃSKI Kamil, JANKOWSKA-MĄKOSA Anna. Bloom time effect depends on muscle type and may determine the results of pH and color instrumental evaluation[J]. Animals, 2021, 11(5): 1282. doi: 10.3390/ani11051282
-
期刊类型引用(4)
1. 郭俊杰,郭正红. 基于深度置信网络的旋转机械在线故障诊断. 计算机测量与控制. 2025(01): 60-68 .  百度学术
百度学术
2. 刘喜庆,张文豪,潘真真. 基于DAL的工业机器人RV齿轮箱故障识别分析. 现代工业经济和信息化. 2024(09): 217-219 . 百度学术
3. 高国泽,郭瑜,赵博涵,王红伟. 基于瞬时角速度信号窄带解调的RV减速器针齿故障检测. 振动与冲击. 2024(22): 155-161+208 . 百度学术
4. 孙长胜,曹浩男. 基于VMD和CNN方法的电机传动系统故障诊断研究. 机械管理开发. 2024(12): 75-77 . 百度学术
其他类型引用(1)


计量
- 文章访问数: 231
- HTML全文浏览量: 23
- PDF下载量: 95
- 被引次数: 5