Detecting damage levels of solar greenhouses from remote sensing images using improved YOLOv5s
-
摘要:
针对目前日光温室损伤程度的统计方法普遍依靠人工目视导致的检测效率低、耗时长、精确度低等问题,该研究提出了一种基于改进YOLOv5s的日光温室损伤等级遥感影像检测模型。首先,采用轻量级MobileNetV3作为主干特征提取网络,减少模型的参数量;其次,利用轻量级的内容感知重组特征嵌入模块(content aware reassembly feature embedding,CARAFE)更新模型的上采样操作,增强特征信息的表达能力,并引入显式视觉中心块(explicit visual center block,EVCBlock)替换和更新颈部层,进一步提升检测精度;最后将目标边界框的原始回归损失函数替换为EIoU(efficient intersection over union)损失函数,提高模型的检测准确率。试验结果表明,与基准模型相比,改进后模型的参数数量和每秒浮点运算次数分别减少了17.91和15.19个百分点,准确率和平均精度均值分别提升了0.4和0.8个百分点;经过实地调查,该模型的平均识别准确率为84.00%,优于Faster R-CNN、SSD、Centernet、YOLOv3等经典目标检测算法。日光温室损伤等级快速识别方法可以快速检测日光温室的数量、损伤等级等信息,减少设施农业管理中的人力成本,为现代化设施农业的建设、管理和改造升级提供信息支持。
Abstract:Solar greenhouses have been widely used in modern precision agriculture in China. However, potential negative environmental impacts can also be introduced, including atmospheric pollution, soil contamination, and water pollution. Great challenges have been posed on the rational management of farmlands and resource utilization. Meanwhile, the manual collection of visual data cannot fully meet the rapid acquisition of information from large-scale greenhouse facilities. In this study, Chinese solar greenhouses (CSGs) were focused on detecting the damage levels from the remote sensing images using an improved YOLO-DLSG (YOLO-damage level of solar greenhouse) object detection model. Comparative experiments were conducted using high-resolution solar greenhouse remote sensing image datasets. A dataset was collected with the 3235 images of solar greenhouses and then subjected to data augmentation. The classification standards were also combined with the damage indicators specific to solar greenhouses. The damage levels were then established from the high-resolution remote sensing satellite images. The YOLOv5s lightweight improvement was employed to reconstruct the YOLOv5s backbone with the lightweight MobileNetV3 architecture. This restructure reduced the channel dimensions and network parameter volume. Furthermore, the upsampling operator in the neck layers was replaced and then updated. A lightweight upsampling operator was selected as CARAFE (content-aware reassembly feature embedding), using an upsampled kernel prediction module. The feature recombination module was reconstructed in the upsample structure. EVCBlock (explicit visual center block) was utilized to further reduce the computational complexity for the high accuracy of detection on rotating objects. Finally, the CIoU (complete intersection over union) loss function for the target bounding box regression was replaced with the EIoU (Enhanced Intersection over Union) loss, in order to accelerate the convergence of the prediction box regression loss function for the high accuracy of prediction box regression. The experimental results show that the improved model reduced the number of parameters and floating-point operations per second by 17.91 and 15.19 percentage points, with an increase of 0.4 and 0.8 percentage points in the precision and mean average precision, respectively. Compared with the current mainstream lightweight models, such as SSD, Faster R-CNN, Centernet, YOLOv3-spp, and YOLOv3-tiny, the improved YOLO-DLSG model demonstrated superior performance, in terms of accuracy, recall, detection speed, and model lightweight. Data collection and accuracy validation were conducted in the Yangling Agricultural Demonstration Zone in Shaanxi Province of China. An average recognition accuracy of 84.00% was achieved in the improved model. A challenging task was to determine the distribution, quantity, and extent of greenhouse damage in a cost-effective, efficient, and user-friendly manner. This finding can provide a simple and effective way for the rapid location and automatic quantity extraction of solar greenhouses with different damage levels.
-
Keywords:
- greenhouse /
- remote sensing /
- deep learning /
- facility agriculture /
- YOLOv5 /
- rapid detection
-
0. 引 言
黑色素是由吲哚类或酚类物质经过氧化聚合形成的一类高分子化合物[1],在自然界中广泛存在[2],具有抑菌[3]、调节血脂[4]、清除自由基[5]等多种生物活性。因此,黑色素作为重要的色素来源和生物活性物质,可被广泛应用于化妆品、保健品和食品领域等多种方面。
食用菌是天然黑色素的来源之一[6],梯棱羊肚菌(Morchella importuna)属于子囊菌门,主要集中在欧洲、亚洲和美洲[7],是一种珍贵的食药兼用菌,因其外观形似羊肚而出名[8]。其中梯棱羊肚菌的主要活性成分之一是黑色素,具有抗辐射、调节免疫力[9]等多种功效,对人体健康有着重要的意义。而如何快速提高梯棱羊肚菌黑色素的提取率就显得尤为重要,过去人们常常采用碱溶酸沉的方法提取黑色素[10],张艳荣等[11]采用超声波辅助的方法提取黑色素,发现其黑色素提取率普遍较低。纤维素酶是由多种酶类共同作用而成的多酶体系,能有效破坏微生物细胞壁,大大提高活性物质的提取效率,其已在诸多活性物质提取中广泛实践[12]。但将纤维素酶应用于梯棱羊肚菌黑色素提取未见报道。由于梯棱羊肚菌黑色素和黑木耳黑色素性质十分相似[13],只溶于碱性溶液,不与水和其它有机溶剂相溶。近年来通过改性的方法以增强黑色素水溶性已成为研究热点,SONG[14]等发现用D-氨基葡萄糖修饰后的粒毛盘菌YM226黑色素在水溶性和生物活性方面比未修饰的粒毛盘菌YM226黑色素有明显提高。
因此,本文探究了纤维素酶-超声波协同提取梯棱羊肚菌黑色素(Morchella importuna melanin, MIM)的提取工艺。并进一步选用赖氨酸进行修饰,得到赖氨酸-梯棱羊肚菌黑色素(lysine-modified Morchella importuna melanin, L-MIM),最后对两者进行结构表征、理化特性及稳定性分析,从而为MIM的高效提取及其产品的开发利用方面提供理论基础。
1. 材料与方法
1.1 材料与试剂
材料:梯棱羊肚菌子实体,购自山西农业大学食用菌中心。
试剂:纤维素酶、氯仿、乙酸乙酯、氯化氢,上海源叶生物科技有限公司;正丁醇,济南远祥化工有限公司;氢氧化钠,上海广涯化工有限公司。
1.2 仪器与设备
Multifuge X1R高速冷冻台式离心机,深圳瑞沃德生命科技有限公司;电子磅秤,厦门维樱仪器有限公司;BPH-7100 pH计,大连贝尔分析仪器有限公司;CWFM-10 L超微振动磨打粉机,广州市大祥电子机械设备有限公司;DF205电热鼓风干燥箱,无锡玛瑞特科技有限公司;RC-HH-2双孔数显恒温水浴锅,睿城永创公司;KQ5200DE数控超声波清洗器,深圳固特超声波有限公司;BCD-215KHM-20 ℃冰箱,北京福意电器有限公司。
1.3 方 法
1.3.1 梯棱羊肚菌黑色素的提取及优化
参考侯若琳等[15]的方法,并稍作修改。将梯棱羊肚菌子实体粉末充分溶解于蒸馏水中,添加适量纤维素酶进行超声处理,再加入NaOH溶液,12 000 r/min离心5 min,收集上清液,用HCl调溶液pH值至1~2,水浴10 h,沉淀经蒸馏水洗至pH=7.0时烘干后得MIM粗品。随后将MIM粗品重新溶于NaOH溶液中,用氯仿、乙酸乙酯除掉多余杂质,用HCl调溶液pH值至1~2,80 ℃条件下水浴2 h,沉淀经蒸馏水洗至pH=7.0时烘干,即得到纯品MIM,提取率计算式为
提取率=M1/M2×100% (1) 式中M1为MIM纯品质量,g;M2为梯棱羊肚菌子实体粉末质量,g。为了确保试验的准确性,所有试验均重复3次,取平均值。
1.3.2 单因素试验
分别设定NaOH浓度(0.5、1.0、1.5、2.0、2.5 mol/L)、纤维素酶添加量(8、12、16、20、24 mg/g)、纤维素酶酶解时间(60、80、100、120、140 min)、纤维素酶酶解温度(30、35、40、45、50 ℃)、料液比(1:10、1:20、1:30、1:40、1:50)、超声时间(40、60、80、100、120 min)进行单因素试验,计算MIM提取率。
1.3.3 Plackett-Burman 试验设计
将提取率作为判断标准,采用Plackett-Burman试验设计方法,对多种影响因素进行研究。表1中的条件变量是基于单因素试验选择的,并尽可能地覆盖了可能影响试验结果的因素,NaOH浓度、纤维素酶添加量、纤维素酶酶解时间、纤维素酶酶解温度、料液比、超声时间,分别用A、B、C、D、E、F表示。
表 1 Plackett-Burman试验设计的因素水平表Table 1. Factors and levels of Plackett-Burman experimental design因素
Factors水平Level −1 1 A/(mol·L-1) 1.0 2.0 B/(mg·g-1) 16 24 C/min 60 100 D/℃ 35 45 E 1:20 1:40 F/min 60 100 注:A表示NaOH浓度,B表示纤维素酶添加量,C表示纤维素酶酶解时间,D表示纤维素酶酶解温度,E表示料液比,F表示超声时间,下同。 Note: A represents NaOH concentration, B represents cellulase addition, C represents cellulase digestion time, D represents cellulase digestion temperature, E represents solid liquid ratio, F represents ultrasound time, the same below. 1.3.4 Box-Behnken试验设计
通过Plackett-Burman试验确定出影响梯棱羊肚菌黑色素提取率的关键因素,分别是NaOH浓度、纤维素酶添加量、纤维素酶酶解时间,如表2所示,采用Box-Behnken响应曲面法进行三因素三水平试验分析。
表 2 Box-Benhnken试验设计Table 2. Box-Benhnken experimental design因素
Factors水平Level −1 0 1 A/(mol·L-1) 1.0 1.5 2.0 B/(mg·g-1) 16 20 24 C/min 60 80 100 1.3.5 确定梯棱羊肚菌黑色素氨基酸修饰种类及质量比
参照YE等[16]的方法,并稍作修改,选择4种氨基酸,分别是精氨酸、赖氨酸、天冬氨酸、组氨酸,将4种氨基酸各称取0.01 g溶于2 mL蒸馏水中,配制成5 g/L的溶液。依次加入0.02 g MIM样品,40 ℃下震荡40 min,反应结束后冷却至室温,12 000 r/min离心2 min,上清液于500 nm波长下检测溶液吸光度。吸光度越高,溶解越完全,氨基酸修饰效果越好。
氨基酸修饰种类确定后,需进一步确定氨基酸的最适添加量。通过改变氨基酸与MIM的质量比,依次加入不同质量的氨基酸,将其混匀后,12 000 r/min离心2 min,于500 nm波长下检测溶液吸光度,以溶液的最大吸光度确定为氨基酸的最适添加量。
1.3.6 梯棱羊肚菌黑色素修饰前后的结构表征
参照王雪青等[17]的方法,并稍作修改,将MIM和L-MIM分别溶解于1.5 mol/L NaOH溶液中,将上清液在200~900 nm的紫外-可见光区进行全波长扫描使用红外光谱仪在波长4000~500 cm−1范围内进行光谱扫描[18-19],将MIM和L-MIM放置于喷金台上进行真空喷金镀膜90 s,对二者进行结构检测。
1.3.7 梯棱羊肚菌黑色素修饰前后的理化性质分析
1)梯棱羊肚菌黑色素修饰前后色价值的测定
参照WANG等[20]的方法,对MIM和L-MIM进行色价值的测定,称取0.01 g MIM和L-MIM样品分别溶解于pH=8.0的柠檬酸磷酸氢二钠缓冲溶液中,水浴1 h,12 000 r/min离心2 min,稀释上清液,在其MIM和L-MIM的最大吸收波长处测定吸光度。色价值计算式为
色价值(E1%1cm)=A⋅r/e (2) 式中A为吸光度;r为测定吸光度时所吸取MIM和L-MIM的稀释倍数;e为MIM和L-MIM的样品质量,g。
2)修饰前后梯棱羊肚菌黑色素溶解度的测定
参照罗星等[21]的方法,并稍做作修改。称取一定量的MIM和L-MIM,分别溶解于2 mL的蒸馏水中,充分混匀后,12 000 r/min离心5 min,经真空冷冻干燥后即得粉末,称质量并记录,溶解度计算式为
溶解度(g/L)=(m1−m2)/v0 (3) 式中m1为烘干后样品质量,g;m2为烘干前样品质量,g;v0为溶剂体积,L。
3)修饰前后梯棱羊肚菌黑色素水溶性的测定
称取一定量的MIM和L-MIM,分别溶解于1 mol/L NaOH溶液、1 mol/L HCl、蒸馏水、无水乙醇、75%乙醇及其他有机溶剂中,12 000 r/min离心2 min,记录颜色变化趋势及溶解情况[6]。
4)梯棱羊肚菌黑色素修饰前后在温度、光照、pH、金属离子方面稳定性的影响
参考XIAO等[22-23]的方法进行温度、光照、pH对MIM和L-MIM稳定性的影响,配制pH=8.0,1 g/L的MIM和L-MIM溶液至100 mL容量瓶中,分别于浓度为0.01%的Fe3+、Fe2+、Cu2+、Ca2+、Mg2+和Zn2+的溶液(g/mL)定容并混匀。静置2和4 h后,在MIM和L-MIM最大吸收波长下记录溶液吸光度。
1.3.8 统计学处理
应用统计软件IBM SPSS Statistics13.0分析数据。
2. 结果与分析
2.1 单因素试验
由图1a可知,随着NaOH浓度的升高,梯棱羊肚菌黑色素提取率呈先上升后下降的趋势。当NaOH浓度为1.5 mol/L时,MIM提取率最高。由此可见在一定的范围内,提高NaOH浓度有利于黑色素的提取。但浓度过高时可能会提取出脂类、蛋白质等其他物质,这些物质与黑色素发生反应导致提取率下降[24]。因此,将MIM的最适NaOH浓度定为1.5 mol/L。由图1b可知,当纤维素酶添加量为20 mg/g时,MIM提取率最高,此时酶浓度逐渐饱和。若再提高加酶量,则不利于细胞壁的降解,造成提取率下降。因此,将MIM的最适纤维素酶添加量定为20 mg/g。由图1c可知,当酶解时间为80 min时,MIM提取率达到最高,随着酶解时间的增加,此时纤维素酶活力减弱,MIM提取率逐渐趋于平缓。因此,将MIM的最适纤维素酶酶解时间定为80 min。由图1d可知,当酶解温度达到40 ℃时,MIM提取率最大,这是因为伴随提取温度的升高,活化分子百分数增加,继而加快有效碰撞次数,提高酶解效率[25]。因此,将MIM的最适酶解温度定为40 ℃。由图1e可知,当料液比为1:30时,MIM提取率最大。可能是因为增加提取溶剂使用量,MIM可以溶解完全,达到饱和状态。若料液比不当会产生过多杂质,这些杂质会与MIM发生反应。因此,将MIM的最适料液比定为1:30。由图1f可知,当超声时间为80 min时,MIM提取率最高,适当的超声时间能够充分破碎细胞壁[26],增大碱溶液与MIM接触面积,有利于MIM完全溶解于碱溶液中。若超声时间过长,会破坏MIM的稳定性,造成提取率降低。因此,将MIM的最适超声时间定为80 min。
![]() 图 1 提取条件对梯棱羊肚菌黑色素提取率的影响注:不同字母表示不同提取条件存在显著性差异(P<0.05),下同。Figure 1. Effects of extraction conditions in extraction rate of Morchella importuna melanin.Note: Different letters represent significant differences in different extraction conditions (P<0.05), the same below.
图 1 提取条件对梯棱羊肚菌黑色素提取率的影响注:不同字母表示不同提取条件存在显著性差异(P<0.05),下同。Figure 1. Effects of extraction conditions in extraction rate of Morchella importuna melanin.Note: Different letters represent significant differences in different extraction conditions (P<0.05), the same below.2.2 Plackett-Burman试验
以提取率为标准设计Plackett-Burman试验,结果如表3所示。试验结果方差分析如表4所示。
表 3 Plackett-Burman 试验结果Table 3. Plackett-Burman experiment results序号
No.A B C D E F 提取率
Extraction rate/%1 2 16 100 45 1:40 100 4.84 2 1 24 60 45 1:40 100 3.36 3 2 24 100 35 1:20 100 6.55 4 1 16 100 45 1:40 60 4.10 5 1 24 60 45 1:20 100 3.98 6 1 16 100 35 1:20 100 4.17 7 2 16 60 45 1:20 60 3.84 8 2 16 60 35 1:40 100 4.33 9 2 24 60 35 1:40 60 5.43 10 1 24 100 35 1:40 60 5.18 11 2 24 100 45 1:20 60 6.32 12 1 16 60 35 1:20 60 3.15 表 4 试验因子的显著性分析Table 4. Significance analysis of variables因素
FactorsF值
F valueP值
P value显著性
SignificanceA 78.17 0.0003 ** B 58.77 0.0006 ** C 71.94 0.0004 ** D 8.08 0.0361 * E 0.85 0.3980 - F 0.90 0.3868 - 注:**表示P<0.01,差异极显著;*表示P<0.05,差异显著;−表示P>0.05,差异不显著。 Note:** represents P<0.01, the difference was extremely significant; * represents P<0.05, the difference was significant; − represents P>0.05, the difference was not significant. 通过表3和表4可以得出,A、B、C三个因素显著性均极其显著(P<0.01)。其大小顺序为A、C、B。因此,可将以上3个因素列为重点考察因素,其他三因素条件不变。
2.3 Box-Benhnken响应面试验结果与分析
在Plackett-Burman试验的基础上,将自变量设定为:NaOH浓度、纤维素酶添加量、纤维素酶酶解时间,MIM提取率作为响应值,设计3因素3水平响应面试验,试验设计及结果见表5,方差分析结果如表6所示。
表 5 Box-Benhnken 响应面试验设计及结果Table 5. Design and results of Box-Benhnken response surface experiment序号
No.A B C 提取率
Extraction rate/%1 1.0 20 100 6.126 2 1.5 20 80 9.632 3 1.0 24 80 6.576 4 1.5 20 80 9.768 5 1.5 24 100 6.607 6 1.5 16 100 6.322 7 1.5 20 80 10.098 8 2.0 20 60 6.647 9 1.0 20 60 6.368 10 1.5 24 60 7.246 11 1.5 20 80 10.152 12 1.0 16 80 6.652 13 1.5 20 80 9.728 14 2.0 20 100 6.674 15 2.0 24 80 7.564 16 1.5 16 60 7.486 17 2.0 16 80 6.906 通过Design-expert 8.0.6软件分析得出A、B、C三个因素与Y之间的回归方程为:Y=-58.02 415+18.61 985A+2.86 272B+0.63 071C+0.09 175AB+0.00 673AC+0.00 164BC-6.82 520A2-0.07 780B2-0.00 429C2。基于回归方程进行方差分析,发现P<0.0001,即该模型具有极显著性。R2=0.9 839,该模型拟合度极好,由此可准确表述各影响因素与MIM提取率之间的关系。失拟项F=2.27不显著(P>0.05),表示该回归方程贴合实际情况。对一次项系数的绝对值分析得出,A、B、C三个因素对MIM提取率的影响因素按大小依次A、C、 B。
根据分析结果绘制响应曲面,如图2所示。由图2可知,响应曲面的倾斜度越高,即坡度越陡,两因素的交互作用越明显。
![]() 图 2 各因素交互作用对梯棱羊肚菌黑色素提取率的响应面图Figure 2. Response surface plots of interaction of various factors on Morchella importuna melanin extraction rate表 6 梯棱羊肚菌黑色素提取率方差分析表Table 6. ANOVA of Morchella importuna melanin extraction rate
图 2 各因素交互作用对梯棱羊肚菌黑色素提取率的响应面图Figure 2. Response surface plots of interaction of various factors on Morchella importuna melanin extraction rate表 6 梯棱羊肚菌黑色素提取率方差分析表Table 6. ANOVA of Morchella importuna melanin extraction rateR2=0.9 839 方差来源
Source of variance平方和
Sum of squares自由度
Degree of freedom(df)均方
Mean squareF值
F valueP值
P value模型 Model 36.06 9 4.01 47.42 <0.0001 A 0.54 1 0.54 6.33 0.0400 B 0.05 1 0.05 0.58 0.4706 C 0.51 1 0.51 6.03 0.0438 AB 0.13 1 0.13 1.59 0.2471 AC 0.02 1 0.02 0.21 0.6576 BC 0.07 1 0.07 0.82 0.3965 A2 12.26 1 12.26 145.11 <0.0001 B2 6.52 1 6.52 77.23 0.0002 C2 12.39 1 12.39 146.69 <0.0001 残差Residual 0.59 7 0.08 失拟值Lack of fit 0.37 3 0.12 2.27 0.2220 净误差Pure error 0.22 4 0.06 总离差Cor total 36.65 16 2.4 验证试验
通过该模型得出预测MIM最优提取条件为NaOH浓度1.54 mol/L、纤维素酶添加量20.14 mg/g、纤维素酶酶解时间78.6 min,在最优提取条件下,预测MIM提取率为9.89568%。
为确保验证模型预测的准确性,对预测参数做进一步验证,考虑试验的可行性,将提取MIM的纤维素酶添加量调整为20 mg/g,NaOH溶液浓度为1.54 mol/L,酶解时间为78.6 min,MIM的提取率为10.003 00%,预测值为9.895 68%,相对误差在0.99%以内,说明该模型较为可靠。
2.5 梯棱羊肚菌黑色素氨基酸种类及质量比的确定
由图3a可知,经过精氨酸、赖氨酸、天冬氨酸、组氨酸修饰后MIM吸光度均有所增加,但L-MIM的吸光度最大。
![]() 图 3 修饰梯棱羊肚菌黑色素的氨基酸种类及质量比的确定Figure 3. Types of amino acid modification of Morchella importuna melanin (MIM) solution and addition amount of lysine
图 3 修饰梯棱羊肚菌黑色素的氨基酸种类及质量比的确定Figure 3. Types of amino acid modification of Morchella importuna melanin (MIM) solution and addition amount of lysine因此,将MIM的最佳修饰氨基酸定为赖氨酸。由图3b可知,当MIM与赖氨酸质量比为1:2时,L-MIM溶液的吸光度最大,此时MIM与赖氨酸溶解完全,即氨基酸修饰效果越好。因此,可将MIM与赖氨酸的最适质量比定为1:2。
2.6 梯棱羊肚菌黑色素修饰前后的紫外-可见光谱扫描及傅里叶红外光谱扫描
由图4a可知,MIM和L-MIM趋势大体相似,在紫外光区(10~380 nm)吸收较强,随后在可见光区(400~700 nm)吸光度逐渐减小。MIM在230 nm处显示有最大特征吸收峰,与黑木耳黑色素[27](210 nm)、灵芝黑色素[26](212 nm)的最大特征吸收峰相似。经赖氨酸修饰后,L-MIM的最大吸收峰向短波方向移动,即219 nm处显示有最大特征吸收峰。此外,MIM和L-MIM在(260 nm)和(280 nm)处无特殊吸收峰,表明样品中核酸和蛋白质等杂质含量较少[28],与项锦敏等[29]报道的趋势一致。
![]() 图 4 梯棱羊肚菌黑色素修饰前后光谱图注:MIM表示梯棱羊肚菌黑色素,L-MIM表示赖氨酸-梯棱羊肚菌黑色素,下同。Figure 4. Spectroscopy analysis of MIM and L-MIMNote: MIM represents Morchella importuna melanin, L-MIM represents lysine-modified Morchella importuna melanin, the same below.
图 4 梯棱羊肚菌黑色素修饰前后光谱图注:MIM表示梯棱羊肚菌黑色素,L-MIM表示赖氨酸-梯棱羊肚菌黑色素,下同。Figure 4. Spectroscopy analysis of MIM and L-MIMNote: MIM represents Morchella importuna melanin, L-MIM represents lysine-modified Morchella importuna melanin, the same below.由图4b可知,3 396 cm−1和3 315 cm−1吸收峰对应OH伸缩振动[30],2 900 cm−1处出现尖而窄的小峰为脂肪族的C-H基团伸缩振动[31],1 650~1 620 cm−1处归属于芳香环中C酰胺I带C-O或COO-[32]。1 382 cm−1和1 402 cm−1处N-H弯曲振动峰和C-H的伸缩振动峰,表明MIM和L-MIM都具有典型黑色素的吲哚结构[33]。在2 131 cm−1处的吸收峰是NH3+的特征吸收峰[34],推测是由于赖氨酸的NH3+引起的,表明赖氨酸修饰成功。
2.7 梯棱羊肚菌黑色素修饰前后的扫描电子显微镜图像分析
由图5a可以看出,MIM样品外观表面光滑,呈均匀的立方体晶体结构,这与刘秋鸣[35]的研究结果相似。由图5b可以看出,L-MIM样品呈大型块状、表面凸起且相互粘连在一起,这可能是因为L-MIM样品易吸潮而出现的颗粒粘连的迹象,与MIM呈现明显不同,表明赖氨酸修饰是成功的。
2.8 梯棱羊肚菌黑色素修饰前后的色价值、溶解度、水溶性的测定
评价天然色素有诸多指标,色价值是其中之一,可直接反映色素含量的多少[35]。根据式(2)计算得出MIM和L-MIM的色价值(E1% 1 cm)分别为480.24和1 771.18,L-MIM的色价值明显高于MIM。
室温下,MIM不溶于水。经赖氨酸修饰后,L-MIM的溶解度为1 016 g/L。因此,该试验说明,修饰过的L-MIM溶解度增大。
由表7可知,MIM易溶于碱性溶液,微溶于乙醇溶液,不溶于水及其它有机溶剂。修饰后的L-MIM水溶性得到明显改善,既可溶于碱性溶液又可溶于水,按其水溶性排序大致为碱性溶液、蒸馏水、乙醇。
表 7 MIM和L-MIM的水溶性Table 7. Water-solubility of MIM and L-MIM类型 type 水溶性 Water solubility MIM L-MIM 蒸馏水Distilled water - ++ NaOH(1 mol·L-1) ++ ++ HCl(1 mol·L-1) - - 无水乙醇Anhydrous ethanol + + 75 %乙醇75 % Ethanol + + 正丁醇N-Butanol - - 氯仿Chloroform - - 冰乙酸Glacial acetic acid - - 异丙醇Isopropanol - - 注:++表示完全溶解,+表示微溶,-表示不溶。 Note: ++ represents fully dissolved, + represents slightly soluble, - represents insoluble. 2.9 梯棱羊肚菌黑色素修饰前后的稳定性的影响
由图6a可知,在保温20 min条件下,MIM和L-MIM的吸光度值在20、40、60、80、100 ℃条件下波动范围较小,且在此温度(20~100 ℃)下,吸光度增长缓慢。由此可知,MIM和L-MIM均具有较高的耐热性,可能与自身结构脱羧作用有关[9]。由图6b可知,MIM和L-MIM经过自然光、紫外光、避光条件下照射24 h,可以观察到两者在自然光和避光条件下吸光度变化较小。此后随着光照时间的延长,在相同的光照时间内,MIM和L-MIM在紫外光的照射下吸光度开始下降,由此可知,MIM和L-MIM在紫外光照射下稳定性差。由图6c可知,当溶液pH值为2~5时,MIM几乎不溶解,当溶液pH值为2~7时,L-MIM的吸光度差别不大,当溶液的pH值大于8时,MIM和L-MIM的吸光度显著升高,溶液颜色逐渐加深,由此可知,MIM和L-MIM在碱性条件下吸光度逐渐升高,即MIM和L-MIM在碱性条件下越稳定,可能是因为在碱性条件下MIM以离子的形式存在[36]。由图6d可知,Fe3+对MIM和L-MIM的稳定性具有显著的影响(P<0.05),可能是因为Fe3+与特定基团结合后,稳定了MIM和L-MIM的结构,并加强增色效果[37],其余的金属离子的吸光度明显变小,说明Fe2+、Cu2+、Ca2+、Mg2+、Zn2+对MIM和L-MIM的稳定性无显著影响(P<0.05)。
![]() 图 6 不同因素对梯棱羊肚菌黑色素修饰前后稳定性的影响Figure 6. Effects of different factors on the stability of MIM and L-MIM
图 6 不同因素对梯棱羊肚菌黑色素修饰前后稳定性的影响Figure 6. Effects of different factors on the stability of MIM and L-MIM3. 结 论
本试验以梯棱羊肚菌为原材料,采用纤维素酶-超声波协同提取梯棱羊肚菌黑色素,并进一步通过赖氨酸修饰,对比修饰前后的结构、理化特性及稳定性。研究发现,NaOH浓度1.54 mol/L,纤维素酶添加量20 mg/g,酶解时间78.6 min,料液比1:30,酶解温度40 ℃,超声时间80 min条件下,MIM提取率最高为10.003 00%。试验结果表明,L-MIM比MIM在水溶性、色价值方面均有所增加。此外二者在不同的温度、光照、碱性条件下均比较稳定,在使用的金属离子中,Fe3+对MIM和L-MIM的稳定性具有最显著的影响(P<0.05)。以上结果为MIM的深加工提供了一定的理论依据。
由于MIM不溶于水、色价值较低,限制了其在食品和化妆品行业的应用。通过赖氨酸修饰后发现L-MIM的色价值、溶解度高于MIM,这将很大程度上促进改性黑色素在食品和化妆品行业的应用。后续可进一步探究修饰前后梯棱羊肚菌黑色素的体外抗氧化活性,并对其抗氧化机理进行深度研究。还可通过动物试验进行体内相关生物活性研究,利用其生物活性,制备成羊肚菌高级营养饮料或者通过胶囊进行填充,不仅能够提供丰富的营养成分,还可以提高其风味,更为重要的是还能保持天然色素的独特属性。
-
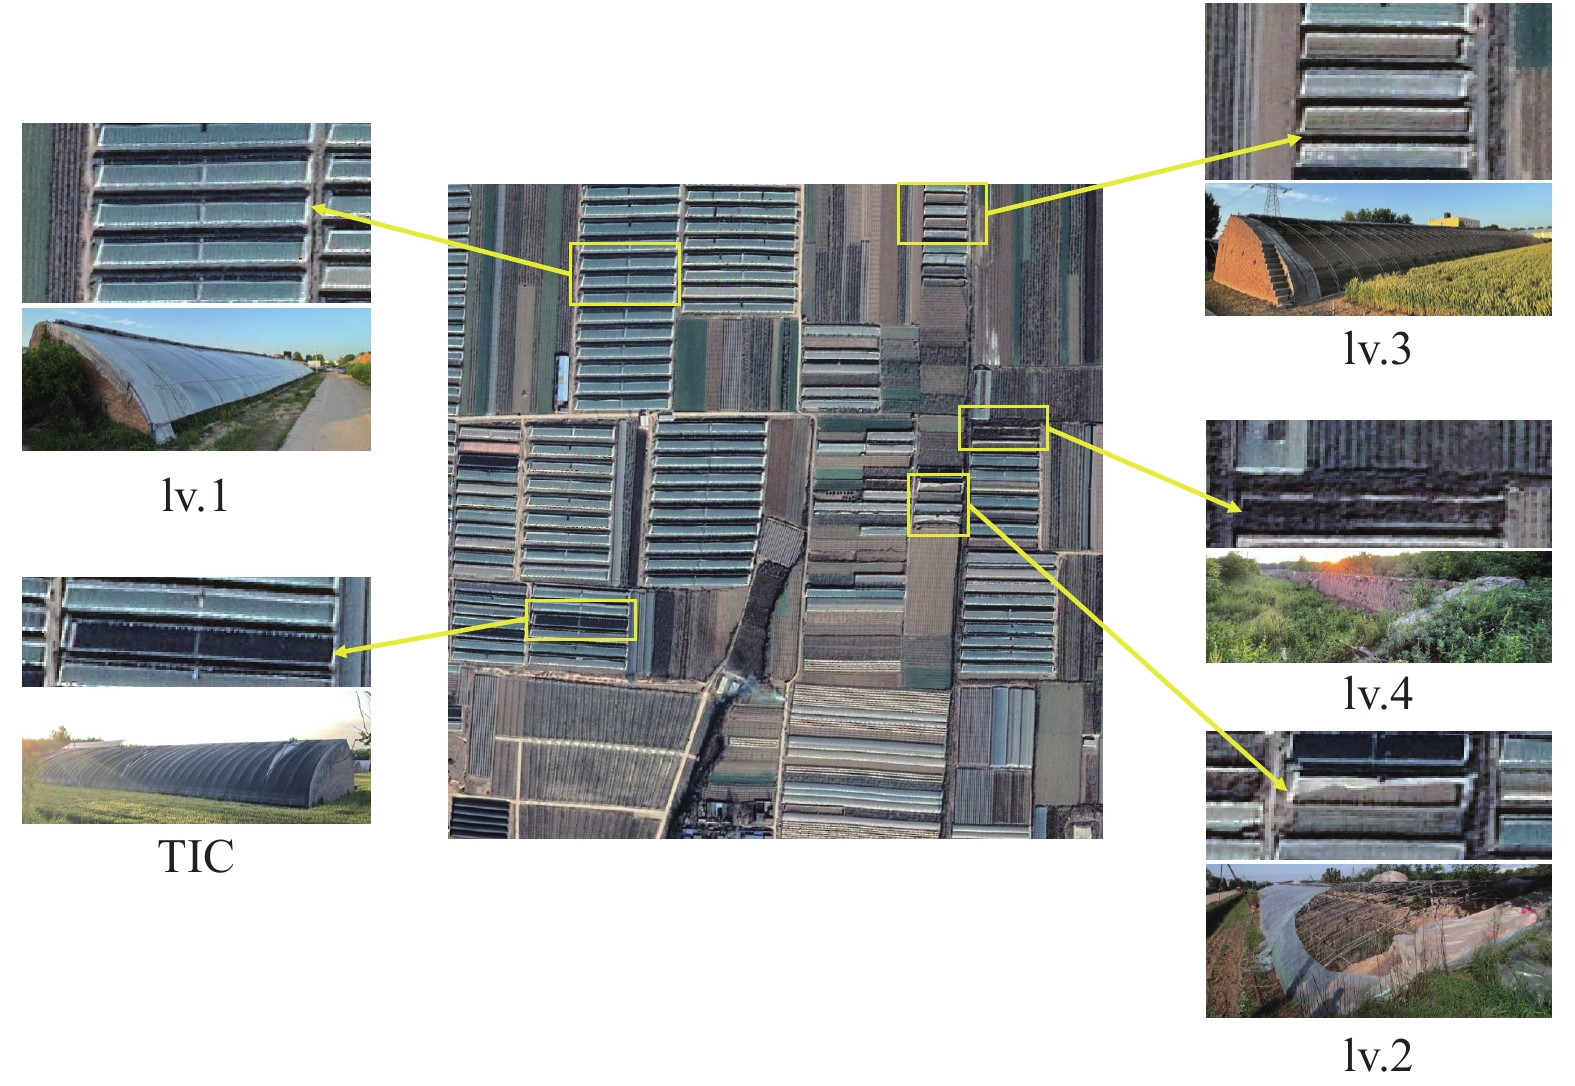
![]()
图 2 日光温室分类标签示意图
注:lv.1,完整日光温室;lv.2,轻度破损日光温室;lv.3,严重破损日光温室;lv.4,废弃日光温室;TIC,覆盖保温被日光温室。
Figure 2. Diagram of classification labels of solar greenhouse
Note:lv.1, complete solar greenhouse; lv.2, slightly damaged solar greenhouse; lv.3, severely damaged solar greenhouse; lv.4, abandoned solar greenhouse; TIC, covered with thermal insulation by solar greenhouse.
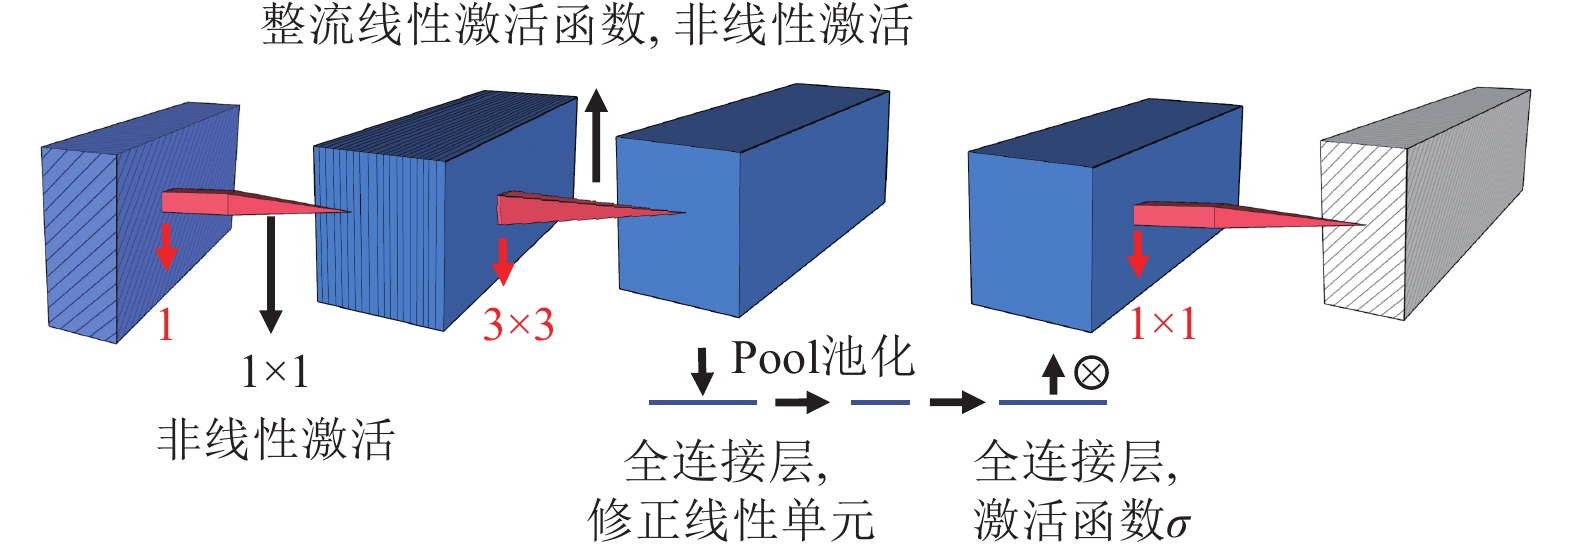
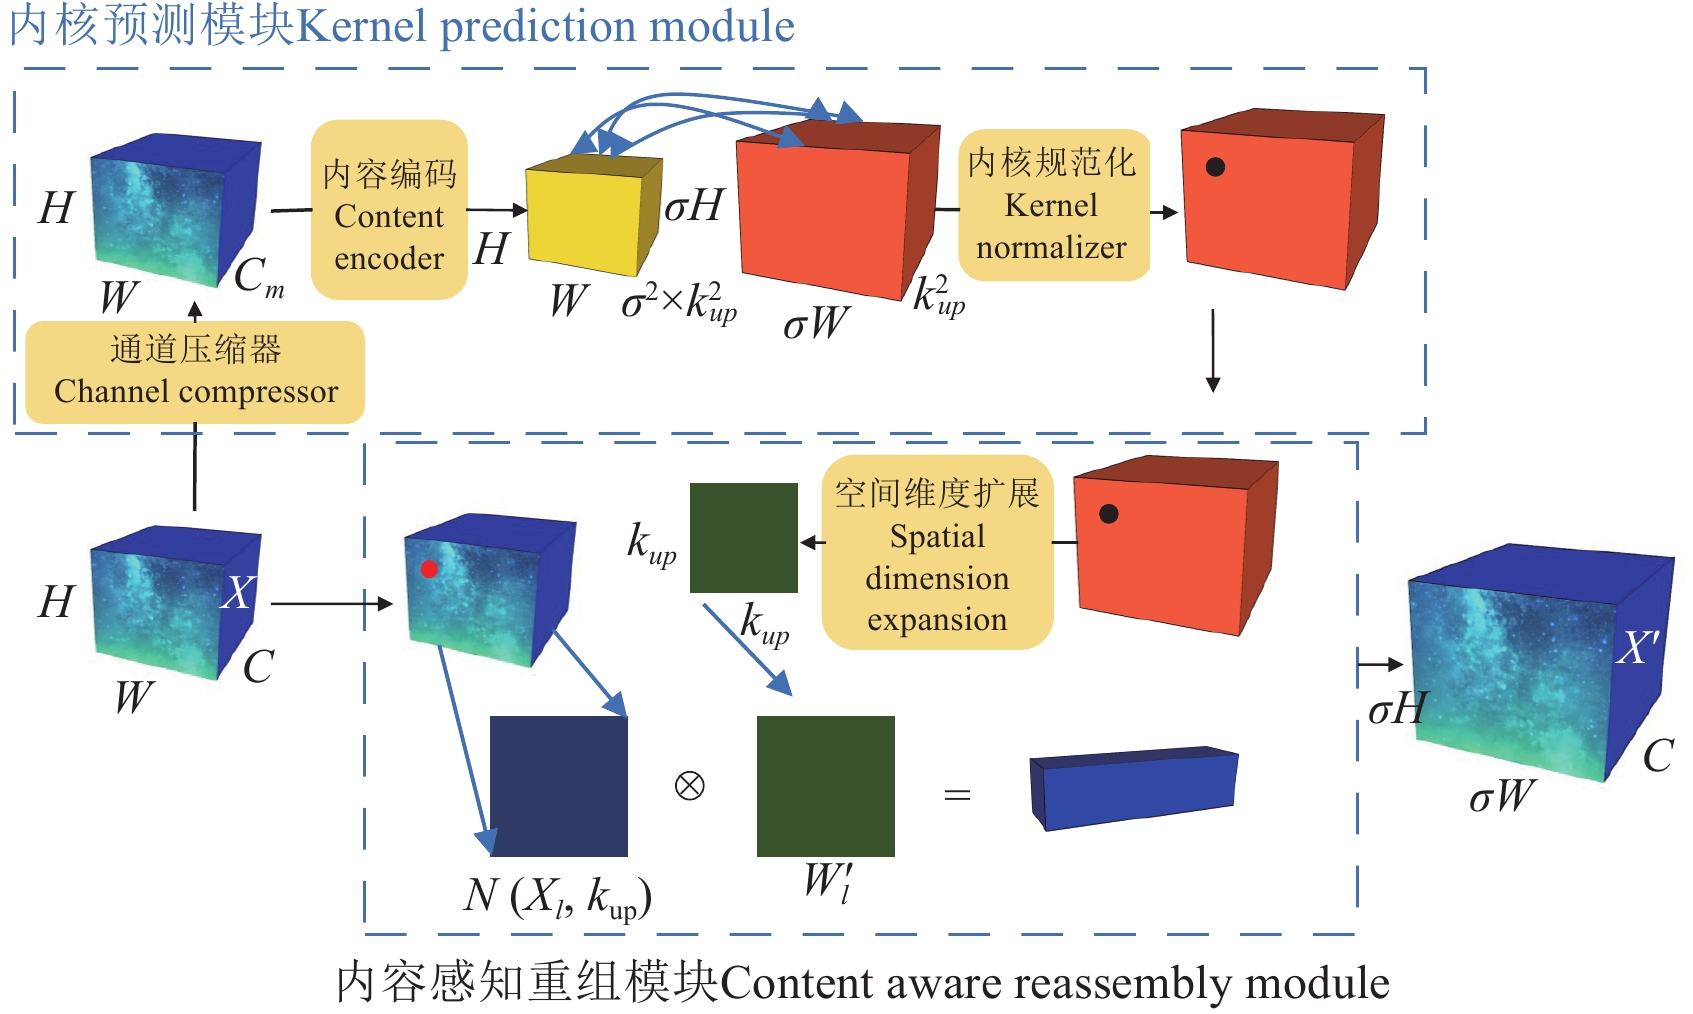
![]()
图 7 CARAFE的结构
注:输入特征图形状为H×W×C,σ为上采样倍率,Cm为压缩通道数,上采样核尺寸为kup×kup。
Figure 7. Structure of CARAFE
Note: Input feature map with shape H×W×C, σ is the upsampling rate, Cm is the number of compressed channels, and the upsampling kernel size is kup×kup.
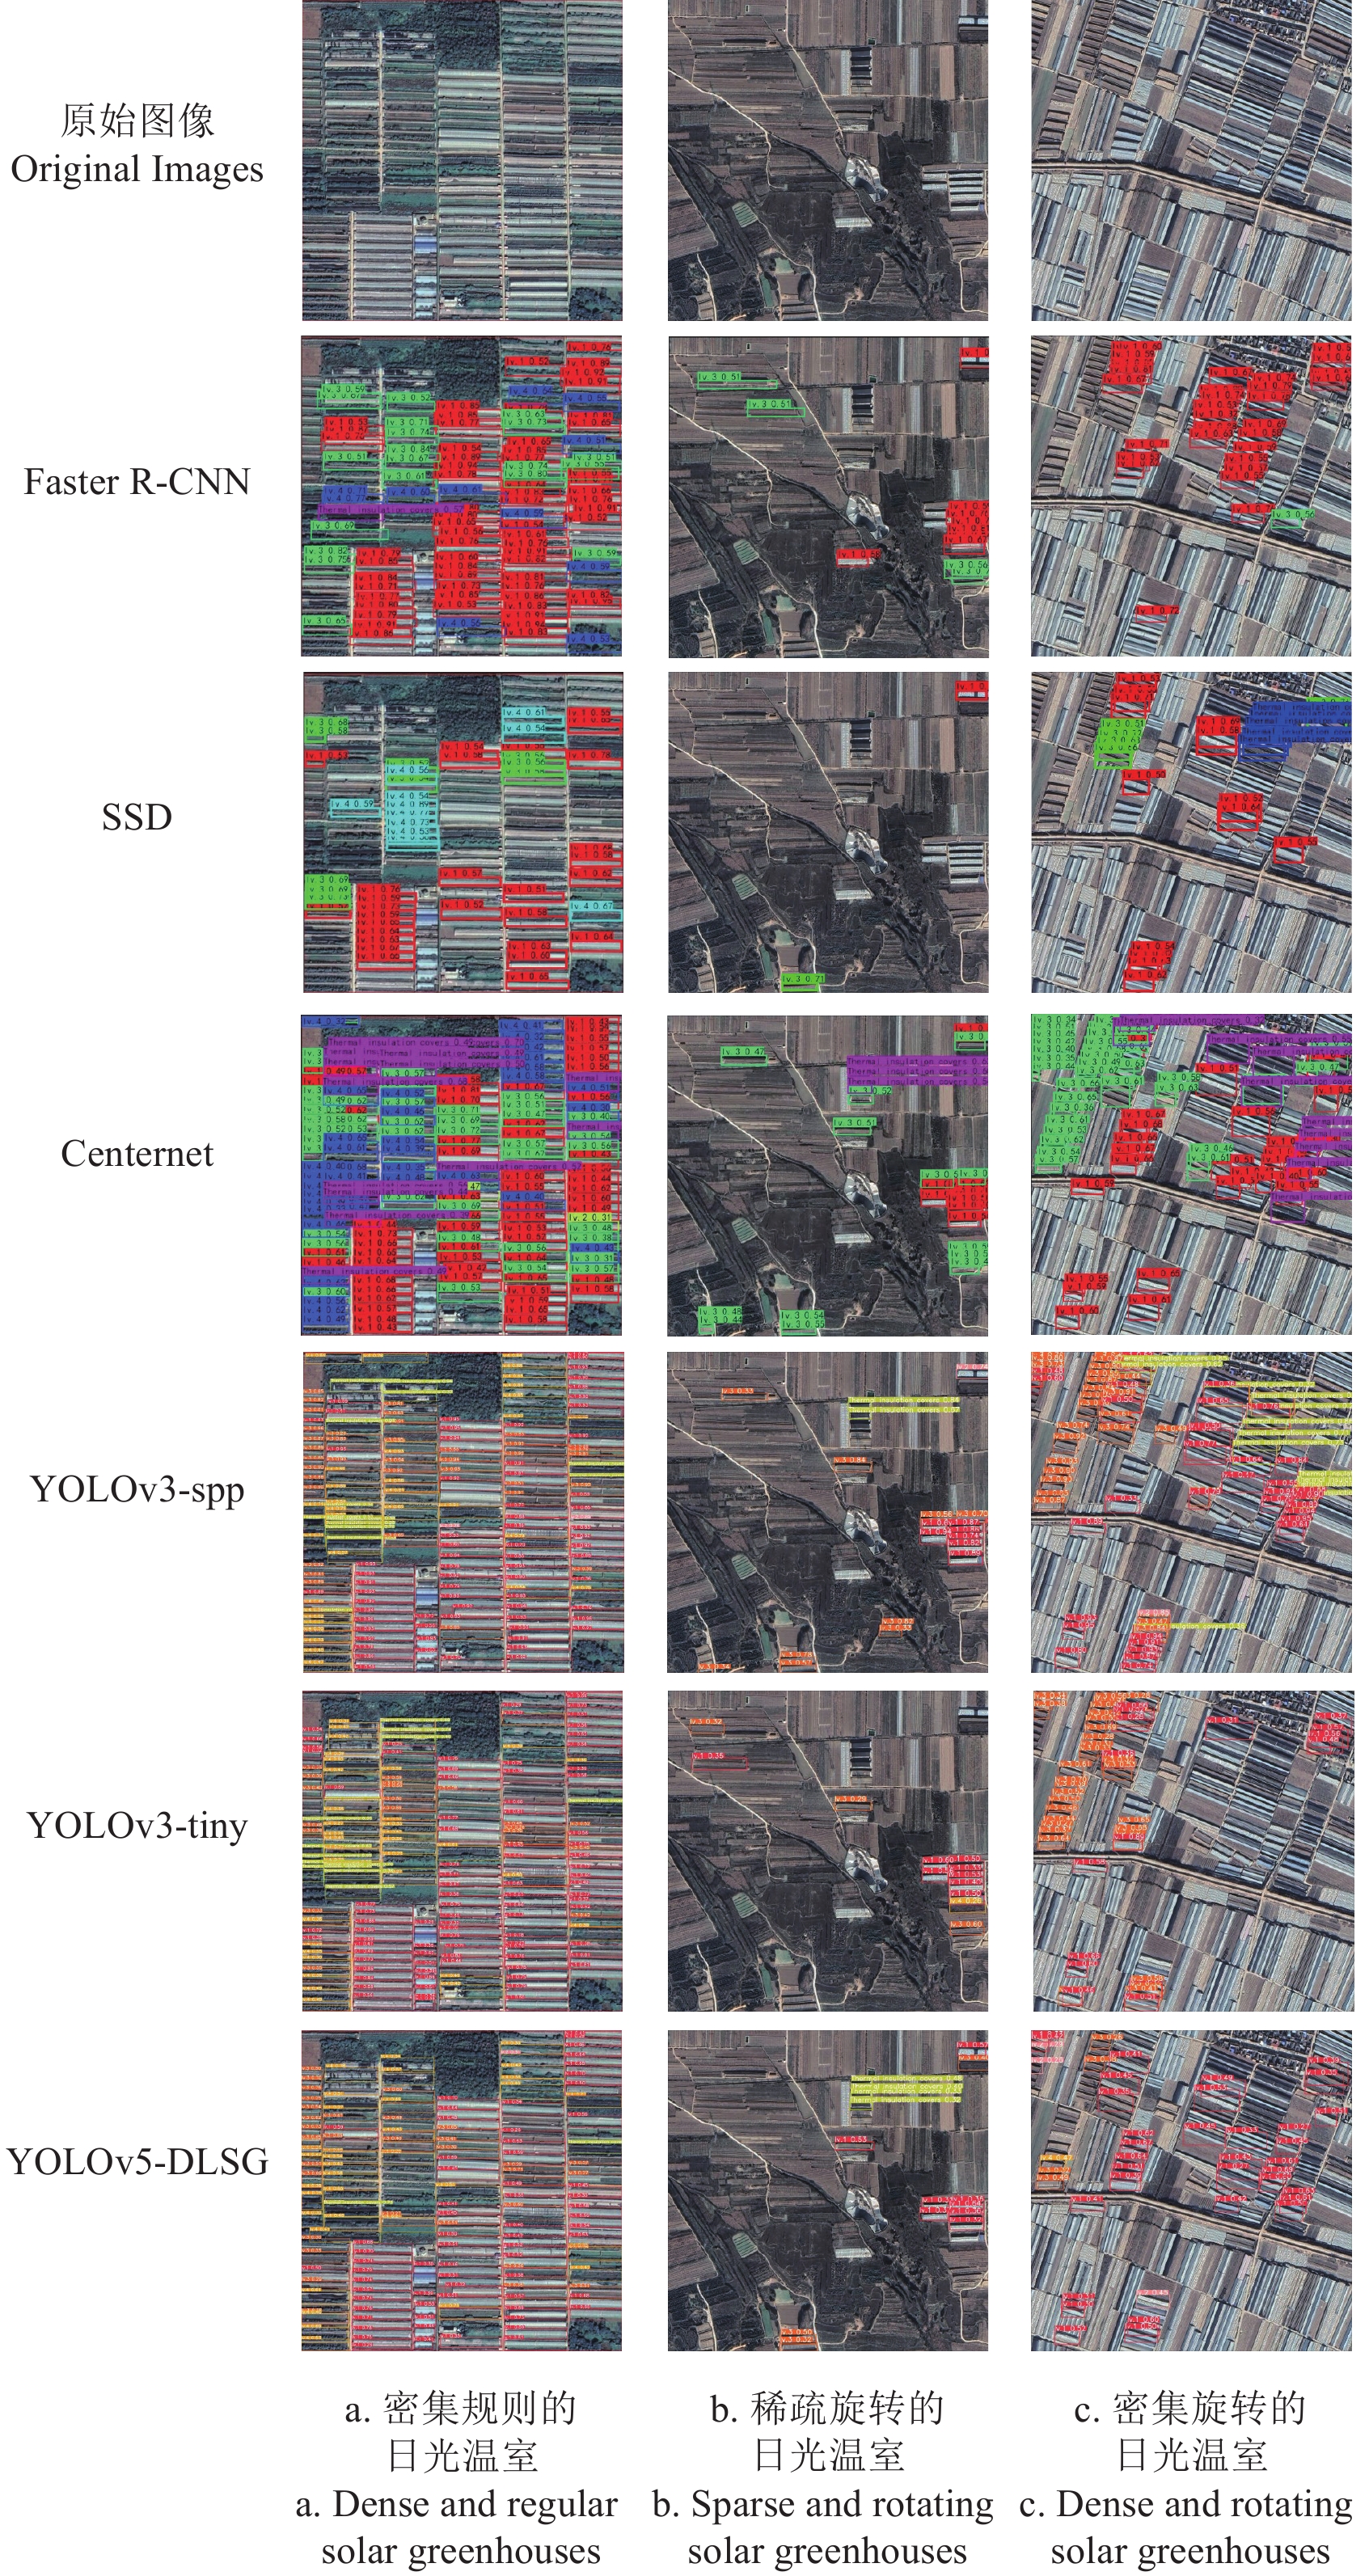
![]()
图 10 不同模型在桶张村日光温室基地分布图上的识别结果对比
Figure 10. Comparison of recognition results of different models on the distribution map of solar greenhouse bases in Tongzhang Village
表 1 硬件和软件环境配置
Table 1 Hardware and software environment configuration
平台
Platform配置
Configuration操作系统Operate system Windows 10 professional 64-bits CPU Intel (R) Core (TM) i9-12900 2.40Hz 32GB GPU NVIDIA RTX A2000 12GB 加速环境Accelerate environment CUDA 11.7 & cuDNN 8.4.1 编译器Compiler Pycharm 2022.3 & Anaconda 脚本语言Script Python 3.9  下载: 导出CSV
表 2 不同模型和YOLO-DLSG的性能对比
Table 2 Comparison of performance between different algorithms and YOLO-DLSG
模型
Model准确率
Precision/%召回率
Recall/%平均精度均值
Mean average precision(mAP)/%F1/% 权重大小
Weight size/MB帧数
Frames per second (FPS)/(帧·s−1)Faster R-CNN 73.65 77.67 77.31 63.16 108.00 9.13 SSD 91.68 66.45 80.45 76.00 92.60 65.54 Centernet 96.52 85.97 91.76 91.00 124.00 40.78 YOLOv3-spp 97.70 96.20 98.00 98.76 125.7 5.94 YOLOv3-tiny 97.10 93.20 97.10 95.11 8.27 11.99 YOLO-DLSG 97.70 93.40 97.40 95.80 12.10 13.02
下载: 导出CSV
表 3 消融试验性能对比
Table 3 Comparison of ablation experiment performance
模型
Model准确率
Precision/%召回率
Recall/%平均精度均值
mAP/%F1/% FLOPs/G 参数量Parameters/MB FPS/(帧·s−1) YOLOv5s 97.60 94.50 97.40 96.02 15.80 6.70 13.12 YOLOv5s-M 98.10 93.60 97.50 95.80 11.30 4.80 12.51 YOLOv5s-M-C 98.10 94.80 98.20 96.42 11.50 4.92 13.21 YOLOv5s-M-C-EVC 97.70 93.40 97.40 95.50 13.40 5.50 13.02 YOLOv5s-M-C-EVC-CIoU 97.40 94.80 98.30 96.08 13.40 5.50 12.59 YOLOv5s-M-C-EVC-DIoU 97.60 94.60 98.30 96.08 13.40 5.50 12.93 YOLOv5s-M-C-EVC-SIoU 97.00 93.30 97.80 95.11 13.40 5.50 13.03 YOLOv5s-M-C-EVC-EIoU 98.00 94.70 98.20 96.32 13.40 5.50 13.35 注:M表示骨干网被MobileNetV3结构替换;C表示上采样运算符已被CARAFE取代;EVC表示将EVCBlock模块添加到主干和头部部分;XIoU(X代表C、D、S、E)表示替换模型的损失函数。 Note: M indicates that the backbone network has been replaced by the MobileNetV3 structure; C indicates that the upsampling operator has been replaced by CARAFE; EVC represents adding the EVCBlock module to the backbone and head sections; XIoU (X represents C, D, S, E) represents the loss function of the replacement model.
下载: 导出CSV
表 4 杨凌区日光温室预测结果与精度
Table 4 Prediction results and accuracy of solar greenhouses in Yangling District
指标Index lv.1 lv.2 lv.3 lv.4 TIC 标签数Labels 1786 175 445 683 92 预测数 Predictions 1780 132 385 512 105 精确度 Precision/% 99.66 75.42 86.52 74.96 87.62
下载: 导出CSV
表 5 桶张村日光温室基地实测数据
Table 5 Actual measurement data of the solar greenhouse base in Tongzhang Village
指标
Indexlv.1 lv.2 lv.3 lv.4 TIC 实际数量Actual quality 142 14 36 54 7 检测数量 Predictions 137 9 29 37 6 精确度 Precision/% 96.48 64.29 80.56 68.52 85.71
下载: 导出CSV
-
[1] 刘建,周长吉. 日光温室结构优化的研究进展与发展方向[J]. 内蒙古农业大学学报(自然科学版),2007(3):264-268. LIU Jian, ZHOU Changji. Research progress and development direction of structural optimization of solar greenhouse[J]. Journal of Inner Mongolia Agricultural University (Natural Science Edition), 2007(3): 264-268. (in Chinese with English abstract)
[2] 刘霓红,蒋先平,程俊峰,等. 国外有机设施园艺现状及对中国设施农业可持续发展的启示[J]. 农业工程学报,2018,34(15):1-9. LIU Nihong, JIANG Xianping, CHENG Junfeng, et al. Current situation of foreign organic greenhouse horticulture and its inspiration for sustainable development of Chinese protected agriculture[J]. Transactions of the Chinese Society of Agricultural Engineering (Transactions of the CSAE), 2018, 34(15): 1-9. (in Chinese with English abstract)
[3] ZHONG T, SI Z, SHI L, et al. Impact of state-led food localization on suburban districts’ farmland use transformation: Greenhouse farming expansion in Nanjing city region, China[J]. Landscape and Urban Planning, 2020, 202: 103872. doi: 10.1016/j.landurbplan.2020.103872
[4] 魏晓明,周长吉,曹楠,等. 中国日光温室结构及性能的演变[J]. 江苏农业学报,2012,28(4):855-860. WEI Xiaoming, ZHOU Changji, CAO Nan, et al. Evolution of the structure and performance of Chinese solar greenhouse[J]. Jiangsu Journal of Agricultural Sciences, 2012, 28(4): 855-860. (in Chinese with English abstract)
[5] WANG C, JIANG Y, BAI Y, WANG T. Numerical study on static properties and failure mechanisms of landing assembled Chinese solar greenhouses[J]. Computers and Electronics in Agriculture, 2021, 188: 106347. doi: 10.1016/j.compag.2021.106347
[6] 张锡煜,李思佳,王翔,等. 基于Sentinel-2卫星影像绥化市土壤全氮定量遥感反演[J]. 农业工程学报,2023,39(15):145-152. ZHANG Xiyu, LI Sijia, WANG Xiang, et al. Quantitative inversion of soil total nitrogen in Suihua city using sentinel-2 remote sensing images[J]. Transactions of the Chinese Society of Agricultural Engineering (Transactions of the CSAE), 2023, 39(15): 145-152. (in Chinese with English abstract)
[7] 杨红卫,童小华. 中高分辨率遥感影像在农业中的应用现状[J]. 农业工程学报,2012,28(24):138-149. YANG Hongwei, TONG Xiaohua. Application status of middle and high resolution remote sensing images in agriculture[J]. Transactions of the Chinese Society of Agricultural Engineering (Transactions of the CSAE), 2012, 28(24): 138-149. (in Chinese with English abstract)
[8] 史舟,梁宗正,杨媛媛,等. 农业遥感研究现状与展望[J]. 农业机械学报,2015,46(2):247-260. SHI Zhou, LIANG Zongzheng, YANG Yuanyuan, et al. Status and prospect of agricultural remote sensing[J]. Transactions of the Chinese Society for Agricultural Machinery, 2015, 46(2): 247-260. (in Chinese with English abstract)
[9] 宋怀波,雒鹏鑫,王亚男,等. 融合YOLOv5s与Criminisi算法的农业遥感图像去云方法研究[J]. 西北农林科技大学学报(自然科学版),2023,51(3):143-154. SONG Huaibo, LUO Pengxin, WANG Yanan, et al. Fusion of YOLOv5s network and Criminisi algorithm to remove clouds from agricultural remote sensing images[J]. Journal of Northwest A& F University (Natural Science Edition), 2023, 51(3): 143-154. (in Chinese with English abstract)
[10] ZHANG X, CHENG B, CHEN J, et al. High-resolution boundary refined convolutional neural network for automatic agricultural greenhouses extraction from GaoFen-2 satellite imageries[J]. Remote Sensing, 2021, 13: 4237. doi: 10.3390/rs13214237
[11] ZHONG T, SI Z, SHI L, et al. Multitemporal greenhouse mapping for high-resolution remote sensing imagery based on an improved YOLOX[J]. Computers and Electronics in Agriculture, 2023, 206: 107689. doi: 10.1016/j.compag.2023.107689
[12] 何斌,张亦博,龚健林,等. 基于改进YOLOv5的夜间温室番茄果实快速识别[J]. 农业机械学报,2022,53(5):201-208. HE Bin, ZHANG Yibo, GONG Jianlin, et al. Fast recognition of tomato fruit in greenhouse at night based on improved YOLOv5[J]. Transactions of the Chinese Society for Agricultural Machinery, 2022, 53(5): 201-208. (in Chinese with English abstract)
[13] 黄丽明,王懿祥,徐琪,等. 采用YOLO算法和无人机影像的松材线虫病异常变色木识别[J]. 农业工程学报,2021,37(14):197-203. HUANG Liming, WANG Yixiang, Xu Qi, et al. Recognition of abnormally discolored trees caused by pine wilt disease using YOLO algorithm and UAV images[J]. Transactions of the Chinese Society of Agricultural Engineering (Transactions of the CSAE), 2021, 37(14): 197-203. (in Chinese with English abstract)
[14] 鞠默然,罗海波,王仲博,等. 改进的YOLOV3算法及其在小目标检测中的应用[J]. 光学学报,2019,39(7):253-260. JU Moran, LUO Haibo, WANG Zhongbo, et al. Improved YOLOV3 algorithm and its application in small target detection[J]. Acta Optica Sinica, 2019, 39(7): 253-260. (in Chinese with English abstract)
[15] 刘颖,刘红燕,范九伦,等. 基于深度学习的小目标检测研究与应用综述[J]. 电子学报,2020,48(3):590-601. LIU Ying, LIU Hongyan, FAN Jiulun, et al. A survey of research and application of small object detection based on deep learning[J]. Acta Electronica Sinica, 2020, 48(3): 590-601. (in Chinese with English abstract)
[16] 李辉,王晓宇,刘云,等. 融合多尺度特征和多重注意力的水下目标检测[J]. 农业工程学报,2022,38(20):129-139. LI Hui, WANG Xiaoyu, LIU Yun, et al. Detecting underwater objects using multi-scale features fusion and multiple attention[J]. Transactions of the Chinese Society of Agricultural Engineering (Transactions of the CSAE), 2022, 38(20): 129-139. (in Chinese with English abstract)
[17] LI M, ZHANG Z, LEI L, et al. Agricultural greenhouses detection in high-resolution satellite images based on convolutional neural networks: Comparison of faster R-CNN, YOLOv3 and SSD[J]. Sensors, 2020, 20: 4938. doi: 10.3390/s20174938
[18] QIAO J, ZHU Y, JIA X, et al. Distributions of arsenic and other heavy metals and health risk assessments for groundwater in the Guanzhong Plain region of China[J]. Environmental Research, 2020, 181: 108957. doi: 10.1016/j.envres.2019.108957
[19] COTRUFO S, SANDU C, GIULIO T F, et al. Building damage assessment scale tailored to remote sensing vertical imagery[J]. European Journal of Remote Sensing, 2018, 51: 991-1005.
[20] MURATORE E. The Use of Geomatics for Emergency Management: The Italian Earthquake Cases in 2016[D]. Torino: Politecnico di Torino, 2017.
[21] 张国祥,张璐,李鑫星,等. 日光温室前屋面覆盖物协调铺卷装置设计与试验[J]. 农业机械学报,2023,54(5):348-358. ZHANG Guoxiang, ZHANG Lu, LI Xinxing, et al. Design and experiment of coordinative operation device of covers on front roof of Chinese solar greenhouse[J]. Transactions of the Chinese Society of Agricultural Machinery, 2023, 54(5): 348-358. (in Chinese with English abstract)
[22] LIU X, WU X, XIA T, et al. New insights of designing thermal insulation and heat storage of Chinese solar greenhouse in high latitudes and cold regions[J]. Energy, 2022, 242: 122953. doi: 10.1016/j.energy.2021.122953
[23] 闫冬梅,徐开亮,周长吉,等. 柔性保温墙椭圆管单管拱架日光温室内力分析及结构优化[J]. 农业工程学报,2023,39(14):215-222. YAN Dongmei, XU Kailiang, ZHOU Changji, et al. Internal force analysis and structure optimization of single oval tube arch solar greenhouse with flexible insulation wall[J]. Transactions of the Chinese Society of Agricultural Engineering (Transactions of the CSAE), 2023, 39(14): 215-222. (in Chinese with English abstract)
[24] GUO Z, SHAO X, XU Y, et al. Identification of village building via Google Earth images and supervised machine learning methods[J]. Remote Sensing, 2016, 8(4): 271.
[25] SALEM M, TSURUSAKI N, DIVIGALPITIVA P. Remote sensing-based detection of agricultural land losses around Greater Cairo since the Egyptian revolution of 2011[J]. Land Use Policy, 2020, 97: 104744. doi: 10.1016/j.landusepol.2020.104744
[26] HOWARD A, SANDLER M, CHU G, et al. Searching for MobileNetV3[C]//Proceedings of the IEEE/CVF Conference on Computer Vision and Pattern Recognition, 2020: 1314-1324. DOI: 10.1109/ICCV.2019.00140
[27] MA N, ZHANG X, ZHENG H, et al. Shufflenet v2: Practical Guidelines for Efficient Cnn Architecture Design[C]//Proceedings of the European Conference on Computer Vision, 2018: 116-131.
[28] HAN K, WANG Y, TIAN Q, et al. Ghostnet: More Features from Cheap Operations[C]//Proceedings of the IEEE/CVF Conference on Computer Vision and Pattern Recognition, 2020: 1580-1589.
[29] WANG J, CHEN K, XU R, et al. CARAFE: Content-aware Reassembly of Features[C]//Proceedings of the IEEE International Conference on Computer Vision, 2019: 3007-3016. DOI: 10.48550/arXiv.1905.02188
[30] QUAN Y, ZHANG D, ZHANG L, et al. Centralized feature pyramid for object detection[J]. IEEE Transactions on Image Processing, 2023, 32: 4341-4354. doi: 10.1109/TIP.2023.3297408
[31] 陆健强,梁效,余超然,等. 基于坐标注意力机制与高效边界框回归损失的线虫快速识别[J]. 农业工程学报,2022,38(22):123-132. doi: 10.11975/j.issn.1002-6819.2022.22.013 LU Jianqiang, LIANG Xiao, YU Chaoran, et al. Fast identification of nematode via coordinate attention mechanism and efficient bounding box regression loss[J]. Transactions of the Chinese Society of Agricultural Engineering (Transactions of the CSAE), 2022, 38(22): 123-132. (in Chinese with English abstract) doi: 10.11975/j.issn.1002-6819.2022.22.013
[32] ZHANG Y, REN W, ZHANG Z, et al. Focal and efficient IOU loss for accurate bounding box regression[J]. Neurocomputing, 2022, 506: 146-157.
-
期刊类型引用(7)
1. 雷泽鑫,罗俊杰,张文正,高静,赵旭强. LUCC多情景模拟下黄土沟壑区流域径流响应规律及其适应性规划对策——以晋西三川河流域为例. 生态学报. 2025(03): 1090-1101 .  百度学术
百度学术
2. 严增,焦菊英,唐柄哲,曹斌挺,李航,梁越,祁泓锟,廖俊,徐倩,严晰芹,李萌萌,姜晓晗,张子琦,李建军. 黄土丘陵沟壑区坡沟系统产流产沙对源-汇-路径格局的响应. 农业工程学报. 2024(05): 118-127 . 本站查看
3. 陈素娥,马瑞,张富,王玲莉,蒋承洋. 甘肃省庆城县极端暴雨下水保措施抵御暴洪灾害的能力. 水土保持通报. 2024(03): 26-35 . 百度学术
4. 王琳,褚珍雄,薛一峰,何小亮,黎静. 考虑降雨-洪水-泥沙作用下的淤地坝溃决致灾风险评估. 水力发电学报. 2024(08): 32-45 . 百度学术
5. 韦江杏,邓羽松. 花岗岩红壤丘陵区崩岗侵蚀与典型切沟侵蚀的异同点探析. 土壤. 2024(04): 718-725 . 百度学术
6. 王小云,韩佩洋. 不同年限梯田土壤团聚体组成特征及演变趋势研究. 土壤通报. 2024(06): 1574-1584 . 百度学术
7. 白晨赟,余小玲,马琛琛,韩晓阳,乔江波,朱元骏. 梯田侧壁显著影响黄土塬区梯田土壤水分空间分布. 水土保持学报. 2024(06): 105-112 . 百度学术
其他类型引用(7)


计量
- 文章访问数: 211
- HTML全文浏览量: 39
- PDF下载量: 100
- 被引次数: 14