Optimization of the spatial layout of farmland from the perspective of multi-scale administrative balance
-
摘要:
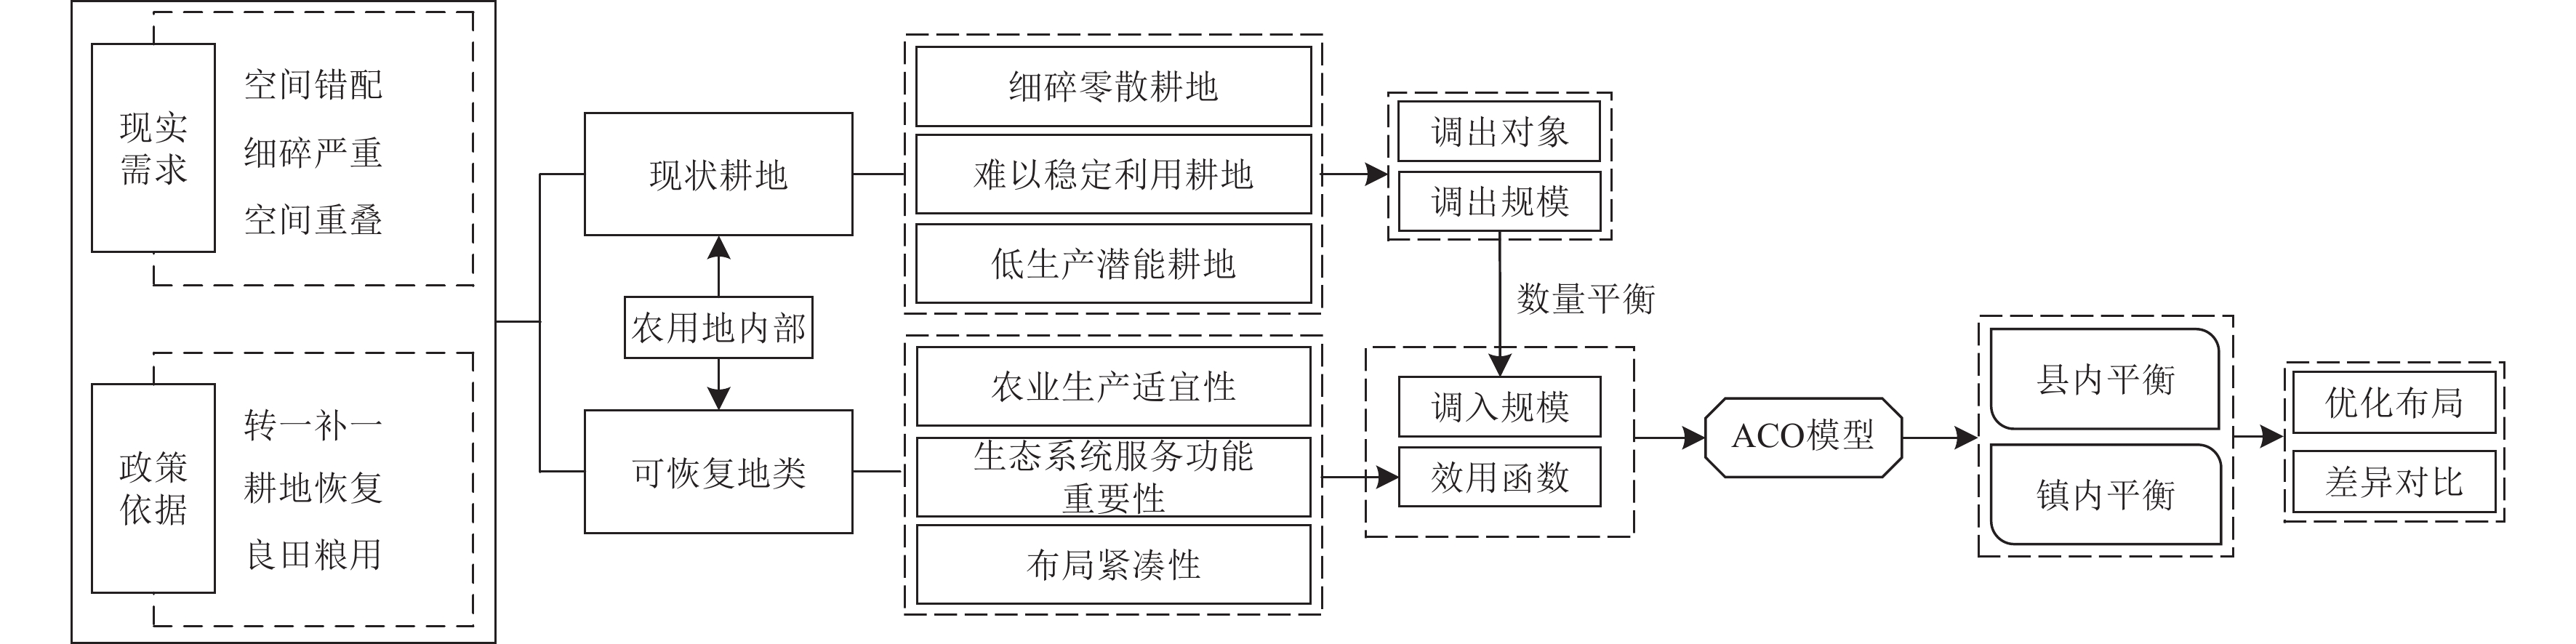
优化耕地空间布局对提升耕地生产能力、促进农业可持续发展具有重要意义。该研究以广东封开县为例,基于“现状耕地调出-可恢复地类调入”的微观调整逻辑,综合运用空间叠加、综合评价及蚁群优化算法,构建了耕地空间布局调整模型,以调入调出数量平衡为约束条件实现了不同行政区尺度下的耕地布局优化。结果表明:1)研究区共调出耕地1 689.89 hm2,占耕地总面积的7.62%,整体上呈现出“全局零散、局部聚集”的分布特征。2)研究区可恢复地类农业生产适宜性均值为67.04,具有开展作物种植的良好禀赋条件。3)不同行政区尺度平衡情景下,调入结果在研究区北部空间差异显著,与镇内平衡情景相比,县内平衡情景下,调入耕地的农业生产适宜性均值提高了2.08,综合生态系统服务均值下降了0.67。4)两种情景下,耕地的连片性、质量及稳定性均得到提升,因不受调入规模和行政单元空间范围限制,县内平衡情景下的提升效果更加明显,适当扩大可恢复地类筛选范围有利于提升整体耕地质量并降低重要生态用地筛选概率。该研究构建的耕地空间布局调整模型具有良好的适用性,可为制定农用地布局优化与整治提升方案提供参考依据。
Abstract:The optimal spatial layout of farmland is of great significance in improving the production capacity. The agricultural and geographical patterns can also be better matched for the national food security. However, the previous researches focus mainly on the spatial layout at the scale of specific administrative districts. It is still lacking in the replacement of farmland with the restored land. Taking Fengkai County in Guangdong Province as an example, this study aims to follow the micro adjustment on "transferring out existing farmland and transferring in restored land". Firstly, the spatial superposition and comprehensive evaluation methods were used to identify the farmland that transferred out with the fragmented, unstable and low production potential. Secondly, the screening utility function was constructed based on the three objectives of the maximization of agricultural production suitability, the minimization of the importance of ecosystem service functions, and the maximization of layout compactness of the restored land. An optimal model was also constructed to adjust the spatial layout of farmland, according to the two aspects of transferring in and out. Taking the balance of the number of transfers in and out as a constraint, the spatial layout of farmland was optimized at different administrative scales. The results showed that: 1) A total of 1,689.89 hm2 of farmland was transferred out of the study area, accounting for 7.62% of the total area of farmland. The overall distribution of farmland was characterized by "global fragmentation and local aggregation". 2) The average suitability of agricultural production and integrated ecosystem services in the restored land were 67.04 and 40.52, respectively, indicating the superior resource endowment in agricultural and ecological production. 3) There were significant differences in farmland that transferred in at administrative scales. The average suitability of agricultural production increased by 2.08 in the farmland that transferred in, whereas, the mean value of comprehensive ecosystem services decreased by 0.67 in the intra-county balance scenario, compared with the intra-town one. The screening of farmland that transferred in was more effective at a wider spatial scale. 4) The quality, stability, and contiguity of optimal farmlands were improved in both scenarios. The optimization was much more outstanding in the intra-county balance scenario, compared with the intra-town one. There were also significant impacts on the administrative scales. An optimal expansion in the screening scale of restored land can be expected to improve the overall quality of farmland and reduce the probability of screening ecologically important land. There were two contributions of this study. Firstly, an optimal model was constructed on the spatial layout with better applicability. The dynamic adjustment was realized to optimize the current farmland and the restored land. Secondly, there were some differences in the spatial layout of farmland at the scale of administrative regions. The administrative regions can be considered to formulate the policies for farmland protection. The finding can provide a strong reference for the decision-making on the optimization of spatial layout of restored land and farmland.
-
0. 引 言
小麦是重要的粮食农作物之一,养育了全世界近三分之一的人口。小麦产量关系到国家粮食安全,小麦产量预测是进行农业生产管理决策的重要参考,因此,如何快速且准确地预估麦穗产量具有重要意义[1-2]。
传统图像处理方法是从麦穗图像中人工提取特征,如麦穗的形状、颜色及纹理等,然后通过分类器构建模型从而实现对图像中麦穗识别与计数[3-4]。FERNANDEZ-GALLEGO等[5]利用拉普拉斯频率滤波器去除麦穗图像中的高低频元素并使用中值滤波器去除高噪声,分割局部峰值完成对图像中麦穗的自动计数。刘哲等[6]改进Bayes抠图算法分割麦穗图像后采用图像滤波、二值化等方法分离出小穗实现麦穗小穗的自动计数。杜颖等[7]利用颜色特征识别并提取麦穗骨架,通过计算骨架角点实现麦穗的自动计数。但人工提取麦穗特征依靠经验丰富的专业人员且依赖麦穗图像质量,所以在复杂的田野环境中传统图像处理技术对麦穗的计数效果并不理想[8-9]。
目前,基于卷积神经网络的检测模型在麦穗检测与计数领域广泛应用。鲍文霞等[10]利用拥挤场景识别网络(CSRNet)生成的麦穗密度,根据密度图中所有密度值的总和,精确统计单位面积麦穗数。杨蜀秦等[11]设计单位面积小麦区域并加入特征重组上采样模块和注意力机制,提高模型精度。KHAKI等[12]提出了麦穗检测模型WheatNet,与传统预测框进行麦穗定位相比,该模型使用点标记麦穗目标并完成计数。黄硕等[13]在YOLOv5模型基础上,在颈网络输出分支加入混合注意力增强网络模型的感知能力,提高模型检测能力。这些方法为麦穗定位与计数提供了有效手段,但基于水平框的检测模型存在固有局限性,例如对遮挡和重叠目标处理能力弱、难以处理复杂背景环境等。
旋转目标检测通过带有旋转角度的矩形进行目标检测,能够获得目标的位置和方向信息,有效提高检测准确性和鲁棒性,在自动驾驶、遥感影像、工业检测和农业等领域有广泛的应用前景[14]。李朝辉等[15]利用多尺度技术检测不同尺度物体并加入了环形圆滑标签解决角度回归问题提高模型检测精度。为提高模型检测精度,庄文华等[16]采用瓶颈注意力加强对关键目标的特征提取能力,有效提高了模型的检测精度。SUN等[17]利用无人机拍摄田野麦穗图像,并提出改进的旋转框小麦头检测与计数模型,从俯视的角度对田野环境麦穗检测与计数。
旋转目标检测虽然在许多场景下取得了较为成功的应用,但田野环境光照、风速以及麦穗遮挡等因素导致麦穗检测与计数难度较大,因此在麦穗检测与计数任务中需要考虑以下3个方面的问题:1)麦穗受趋光特性或风的影响会倾斜生长出现重叠和遮挡,部分麦穗呈现不完整导致难以仅通过外形进行检测与计数;2)麦穗生理性差异,同种麦穗因为光照、湿度等环境因素出现大小及外形等性状差异,影响检测结果;3)田野环境的复杂性,风速以及光照导致采集的麦穗图像清晰度参差不齐,给麦穗检测与计数带来极大困难。为解决这些问题,本文拟采用Oriented R-CNN[18]作为检测模型并针对麦穗检测与计数场景进行研究与优化。
针对麦穗分布密集,外形与大小存在差异,环境复杂等问题,本文在主干网络加入跨阶段局部空间金字塔(SPPCSPC,spatial pyramid pooling cross stage partial networks)[19]模块扩大模型感受野,加强对麦穗特征提取能力,增强网络感知能力;同时,在颈网络中引入路径聚合网络(PANet,path aggregation network)[20]并在特征融合分支加入混合注意力机制(E2CBAM,efficient two convolutional block attention module)丰富特征图包含的麦穗特征信息;最后使用柔性非极大值抑制算法(Soft-NMS,soft-non maximum suppression)[21]优化预测框筛选流程,避免因麦穗遮挡导致漏检,以期满足复杂环境下麦穗的精准快速检测与计数任务需求,为实际观察麦穗长势及数量统计提供一定的技术参考与指导。
1. 材料与方法
1.1 试验数据
1.1.1 数据收集与分析
试验材料选取全球小麦数据集[22](GWHD,https://www.kaggle.com/competitions/global-wheat-detection/data.)和南京白马镇麦穗图像,其中arvalis_1、arvalis_2、arvalis_3以及inrae_1种类的麦穗图像拍摄于法国;enthz_1种类的麦穗图像拍摄于瑞士;rres_1种类的麦穗图像拍摄于英国;Usask_1种类的麦穗图像拍摄于加拿大,将南京白马镇采集麦穗图像作为验证集检验模型鲁棒性。所选取样本包含多角度、多位置、环境多样、背景复杂的麦穗图像,如图1所示。共选取分辨率1 024×1 024像素PNG格式图像共1 000张。
由于麦穗形状狭长、分布密集,采用旋转框标注能更准确地表示麦穗区域,避免框内包含更多背景,两种标注的效果对比如图2所示。表1统计了采用水平框(HBB)与旋转框(OBB)标注的麦穗平均像素面积,在7类小麦图像中,旋转框使得麦穗标注的像素面积至少减少30.57%,种类为arvalis_2的麦穗标注框面积更是减少了62.63%,因此旋转框标注能更准确地获得麦穗特征,减少背景和相邻目标的干扰。
![]() 图 2 水平框与旋转框视觉效果对比Figure 2. Comparison of the visual effect of horizontal bounding boxes and oriented bounding boxes表 1 水平框与旋转框平均面积差异Table 1. Difference of average area of horizontal and oriented bounding boxes
图 2 水平框与旋转框视觉效果对比Figure 2. Comparison of the visual effect of horizontal bounding boxes and oriented bounding boxes表 1 水平框与旋转框平均面积差异Table 1. Difference of average area of horizontal and oriented bounding boxes麦穗种类
Wheat variety平均面积Average area (HBB-OBB)/
HBB/%水平框(HBB)
Horizontal bounding boxes旋转框(OBB)Orientation bounding boxes arvalis_1 4442.3 1961.4 55.85 arvalis_2 5918.8 2212.1 62.63 arvalis_3 9851.0 5568.7 43.47 ethz_1 3334.5 2315.0 30.57 inrae_1 14867.3 6164.4 58.54 rres_1 6140.4 3816.4 37.85 usask_1 12790.2 5412.4 57.68 注:arvalis_1~arvalis_3以及inrae_1麦穗拍摄于法国;enthz_1麦穗拍摄于瑞士;rres_1麦穗拍摄于英国;Usask_1麦穗拍摄于加拿大。
Note: arvalis_1 ~ arvalis_3 and inrae_1 wheat were taken in France; enthz_1 wheat was taken in Switzerland; rres_1 wheat was taken in England; Usask_1 wheat was taken in Canada.1.1.2 数据集构建
本试验采用roLabelImg标注工具对原始图片中每个麦穗目标所在的区域进行旋转框标注并注明其所属类别,按照PASCAL VOC格式生成标注文件(.xml),旋转框标注信息表示为(x,y,w,h,θ)分别表示框中心点坐标(x,y)、宽和高(w,h)以及相较于水平框的旋转角度θ。因模型训练需要,将PASCAL VOC标注文件(.xml)转化为DOTA标注文件(.txt),旋转框的位置采用八参数即4个顶点坐标(x1,y1)、(x2,y2)、(x3,y3)、(x4,y4)表示。将构建的旋转框标注全球小麦数据集(RGWHD)按照7:1:2的比例随机分为训练集、验证集和测试集。
1.2 基于改进Oriented R-CNN的麦穗检测模型构建
Oriented R-CNN是目前旋转目标检测算法领域中检测精度相对较高的两阶段检测模型,其主要结构包括输入端数据预处理、主干网络(Backbone)、颈网络(Neck)、区域候选网络(Rotated RPN, rotated region proposal network)、头部网络(Head)。在模型预处理阶段采用图像旋转等策略增强数据集样本多样性;主干网络Backbone使用ResNet-50[23]网络对图像进行特征提取,其核心思想是残差学习,在残差结构中添加跨层链接,通过堆叠残差模块构建深度网络,解决梯度不稳定问题;颈网络Neck采用特征金字塔网络(FPN, feature pyramid network),通过融合不同尺度的特征图,丰富了特征图中所包含的语义和目标位置信息;区域候选网络(Rotated RPN)在特征图上生成尺度不同的建议框;头部网络(Head)将特征图信息与建议框信息整合输入至ROI层后经过全连接层得到模型的输出信息。
在田野环境中,针对麦穗目标小、遮挡导致模型精度不理想的问题,提出一种改进Oriented R-CNN的检测模型,结构如图3所示,在特征提取网络ResNet-50中引入跨阶段局部空间金字塔模块SPPCSPC增大感受野,提升模型对小目标的检测能力;此外,为了进一步提高模型特征学习能力,在颈网络FPN加入路径聚合网络PANet和混合注意力机制E2CBAM丰富特征图中所包含的特征信息;最后,针对小目标检测,采用柔性非极大值抑制算法Soft-NMS优化预测框的筛选过程,避免部分预测框因筛选算法被误删导致小目标漏检。
![]() 图 3 改进后的Oriented R-CNN结构注:P2、P3、P4、P5、C2、C3、C4、C5和C6表示特征图;变量(x,y,w,h)表示框的中心点坐标以及宽高;△α和△β表示边中点偏移量;θ表示边界框回归角度;SPPCSPC代表跨阶段局部特征金字塔模块;E2CBAM代表混合注意力模块。Figure 3. Improved Oriented R-CNN structureNote: P2, P3, P4, P5, C2, C3, C4, C5 and C6 represent feature maps; The variables (x,y,w,h) represent the center point coordinates of the frame and its width and height; △α and △β represent the offset of the edge midpoint; θ represents the boundary box regression angle; SPPCSPC stands for spatial pyramid pooling cross stage partial networks; E2CBAM stands for hybrid attention mechanism module.
图 3 改进后的Oriented R-CNN结构注:P2、P3、P4、P5、C2、C3、C4、C5和C6表示特征图;变量(x,y,w,h)表示框的中心点坐标以及宽高;△α和△β表示边中点偏移量;θ表示边界框回归角度;SPPCSPC代表跨阶段局部特征金字塔模块;E2CBAM代表混合注意力模块。Figure 3. Improved Oriented R-CNN structureNote: P2, P3, P4, P5, C2, C3, C4, C5 and C6 represent feature maps; The variables (x,y,w,h) represent the center point coordinates of the frame and its width and height; △α and △β represent the offset of the edge midpoint; θ represents the boundary box regression angle; SPPCSPC stands for spatial pyramid pooling cross stage partial networks; E2CBAM stands for hybrid attention mechanism module.1.2.1 主干网络中引入跨阶段局部空间金字塔模块
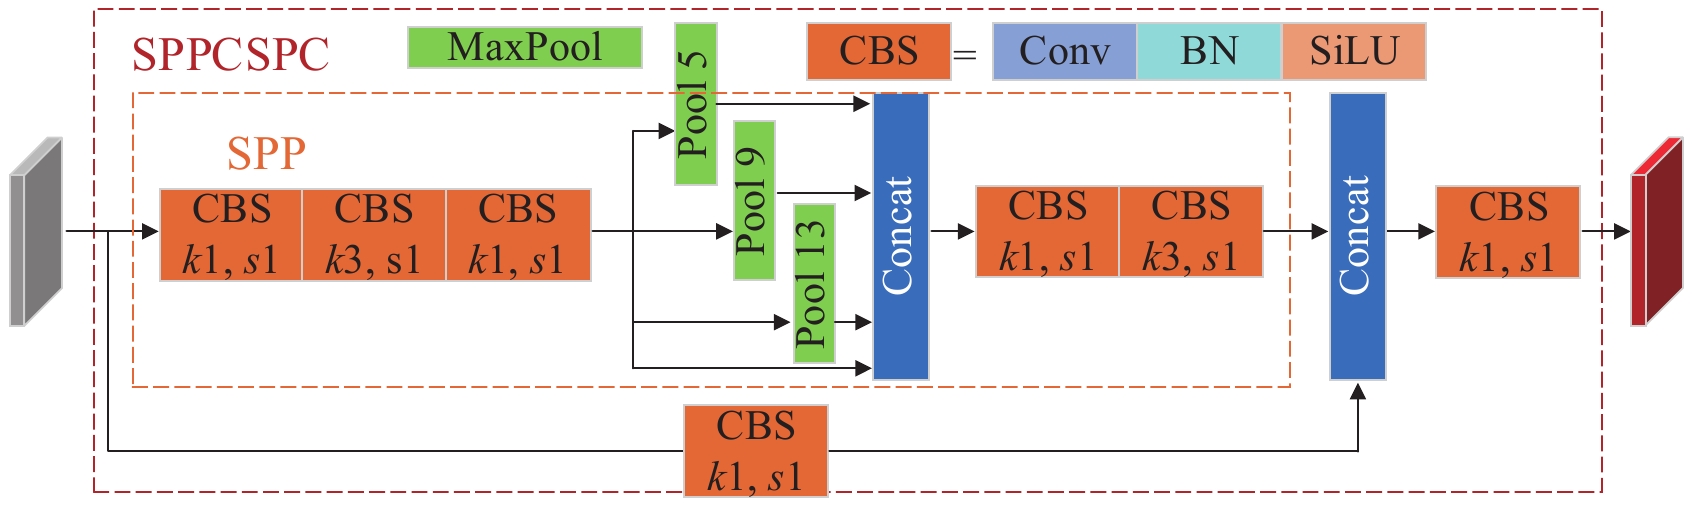
跨阶段局部空间金字塔(SPPCSPC, spatial pyramid pooling cross stage partial networks)模块是以空间金字塔池化模块(SPP, Spatial Pyramid Pooling)为基础,结合跨阶段局部网络(CSP, cross stage partial networks)[24]组合而成,如图4所示。CSP模块将主干网络提取的特征输入至卷积分支和SPP模块分支,最后将两个分支输出的特征图合并进行Concat操作进行特征融合,减少了模型一半计算量的同时提高了模型的速度及精度。
![]() 图 4 SPPCSPC模块结构注:k1表示卷积核大小等于1×1;k3表示卷积核大小等于3×3;s1表示步长为1;Pool 5、Pool 9、Pool 13分别表示最大池化的池化核大小为5、9、13;CBS模块中Conv表示卷积操作;BN表示批量归一化;SiLU是激活函数。Figure 4. Structure of the SPPCSPC moduleNote: k1 represents the convolution kernel_size=1×1; k3 represents the convolution kernel_size=3×3; s1 represents a step size of 1; Pool 5, Pool 9, and Pool 13 indicate that the max pool core size is 5, 9, and 13, respectively; In the CBS module, Conv represents the convolution operation; BN represents batch normalization; SiLU is the activation function.
图 4 SPPCSPC模块结构注:k1表示卷积核大小等于1×1;k3表示卷积核大小等于3×3;s1表示步长为1;Pool 5、Pool 9、Pool 13分别表示最大池化的池化核大小为5、9、13;CBS模块中Conv表示卷积操作;BN表示批量归一化;SiLU是激活函数。Figure 4. Structure of the SPPCSPC moduleNote: k1 represents the convolution kernel_size=1×1; k3 represents the convolution kernel_size=3×3; s1 represents a step size of 1; Pool 5, Pool 9, and Pool 13 indicate that the max pool core size is 5, 9, and 13, respectively; In the CBS module, Conv represents the convolution operation; BN represents batch normalization; SiLU is the activation function.该操作过程细化为:
1)将主干网络所提取的特征图分别输入至两分支,其中,SPP模块分支首先对输入特征图进行1×1以及3×3的卷积处理提取特征,然后输入至SPP模块进行池化操作处理,最后再通过3×3的卷积提取特征;卷积分支只对输入特征图进行1×1的卷积处理。
2)将两分支的输出特征图进行Concat操作后再经过1×1的卷积模块处理调整输出通道,输出包含更多特征信息的不同尺度特征图。
在上述过程中,1×1的卷积模块主要目的是为了调整特征图的通道数,3×3的卷积模块用于减少因池化处理造成的特征信息丢失,丰富特征图语义信息。卷积分支主要作用是避免提取过多重复梯度信息同时减少网络传播过程中的梯度信息损失。
SPP模块由4个最大池化层分支组成,其池化核大小分别为5、9、13和1,4种池化核大小不同的最大池化分支能扩大感受野,使其能够处理不同尺度的感受野对象,能够更好的区分样本中大目标与小目标。
1.2.2 颈网络中引入路径聚合网络及混合注意力模块
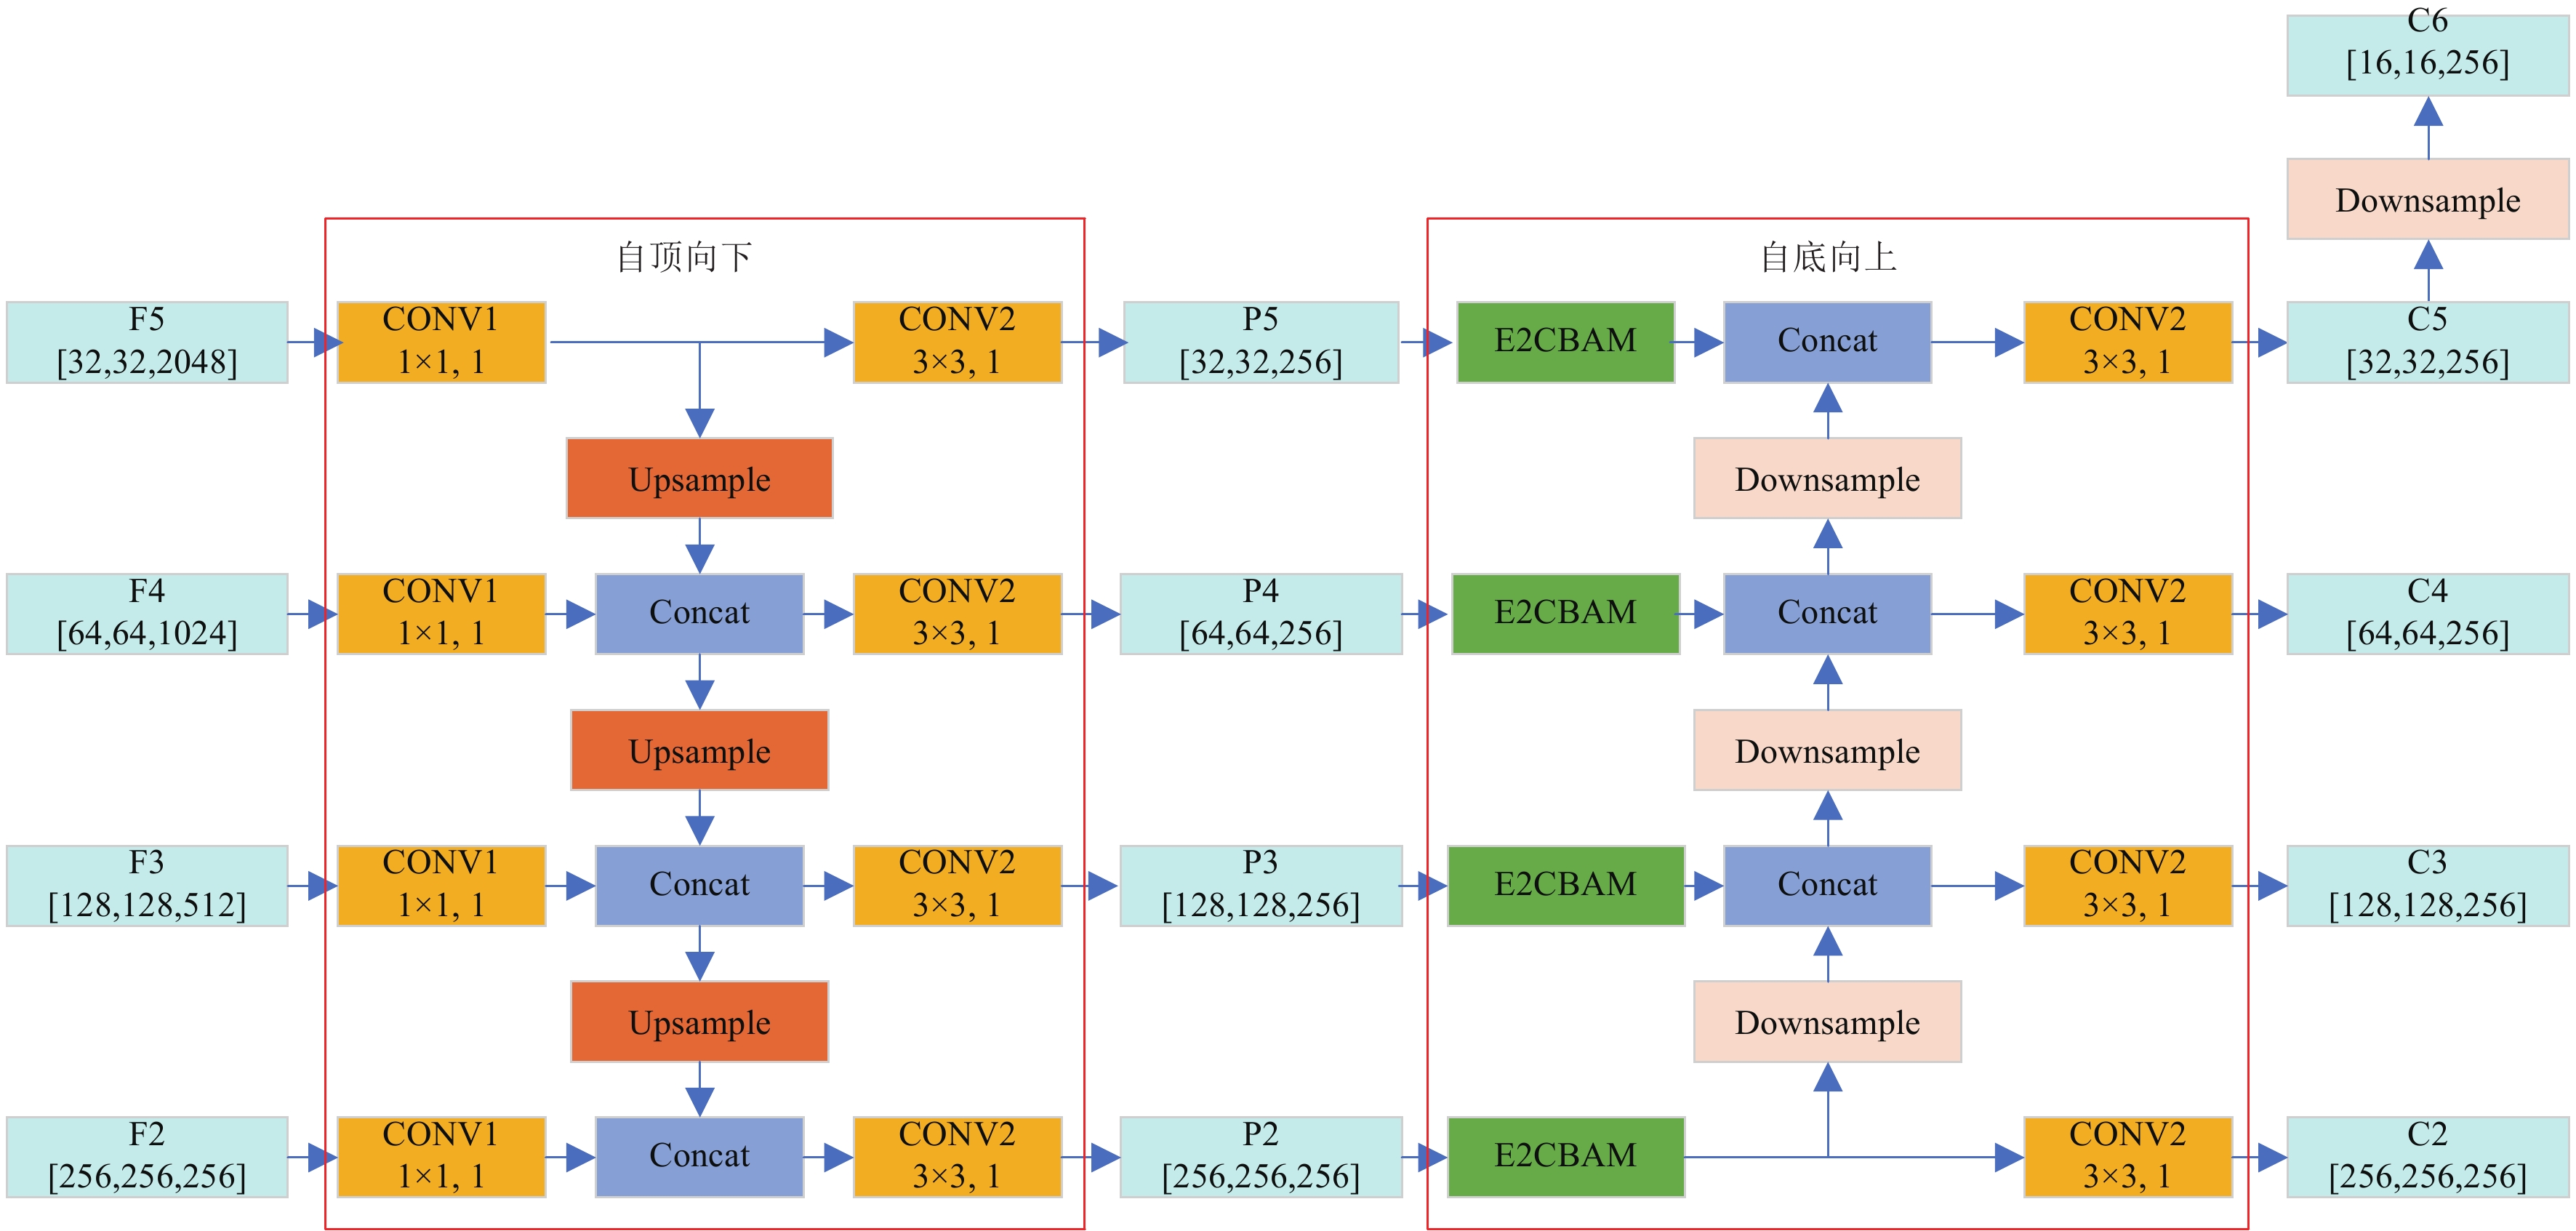
传统特征金字塔网络FPN建立了自顶向下的特征融合通道,高层特征图所包含的语义信息和目标位置信息得以传递给低层特征图,使得模型可以学习到更多的目标特征从而提高检测精度。
为了应对田野环境中小麦头部分布不均匀且重叠导致检测精度不理想的情况,引入了路径聚合网络结构(PANet),该网络在FPN的基础之上搭建了自底向上的信息传递通道,有效解决了FPN网络单向信息传递导致低层特征图所包含的信息无法传递给高层特征图的难题,进一步丰富了特征图中所包含的语义信息和目标位置信息,能够更好地满足实际麦穗检测任务对精度的需求。
为了充分利用主干网络提取的目标特征信息,在特征图融合阶段进一步增强上下文信息的交互,从而提高模型准确率。针对田野环境中麦穗目标小且分布密集的特点,在PANet网络结构特征图融合连接中添加E2CBAM混合注意力模块,使得整体网络模型获得更加充分的目标信息,避免小目标漏检,改进后的颈网络结构如图5所示。
![]() 图 5 改进后颈网络结构注:CONV1模块表示卷积核大小等于1×1,步长为1的卷积操作;CONV2模块表示卷积核大小等于3×3,步长为1的卷积操作;Upsample为上采样模块;Downsample为下采样模块;E2CBAM是引入的混合注意力机制;Concat是拼接操作。Figure 5. Structure of the improved neck networkNote: CONV1 module means a convolution operation with kernel_size=1×1 and stride is 1; CONV2 module means a convolution operation with kernel_size=3×3 and stride is 1;Upsample is an upsampling module; Downsample is a downsampling module; E2CBAM is the hybrid attention mechanism introduced; Concat is a concatenation operation.
图 5 改进后颈网络结构注:CONV1模块表示卷积核大小等于1×1,步长为1的卷积操作;CONV2模块表示卷积核大小等于3×3,步长为1的卷积操作;Upsample为上采样模块;Downsample为下采样模块;E2CBAM是引入的混合注意力机制;Concat是拼接操作。Figure 5. Structure of the improved neck networkNote: CONV1 module means a convolution operation with kernel_size=1×1 and stride is 1; CONV2 module means a convolution operation with kernel_size=3×3 and stride is 1;Upsample is an upsampling module; Downsample is a downsampling module; E2CBAM is the hybrid attention mechanism introduced; Concat is a concatenation operation.CBAM是WOO等[25]提出的一种混合注意力机制模块,从通道和空间两个作用域入手,对输入特征图先进行通道模块(CAM)处理后再通过空间注意力模块(SAM),实现端到端的混合注意力机制,其中CAM模块注重对特征图通道的分配关系;SAM模块使得模型更关注对目标类别判断的关键像素区域,减少对非重点像素区域的关注。
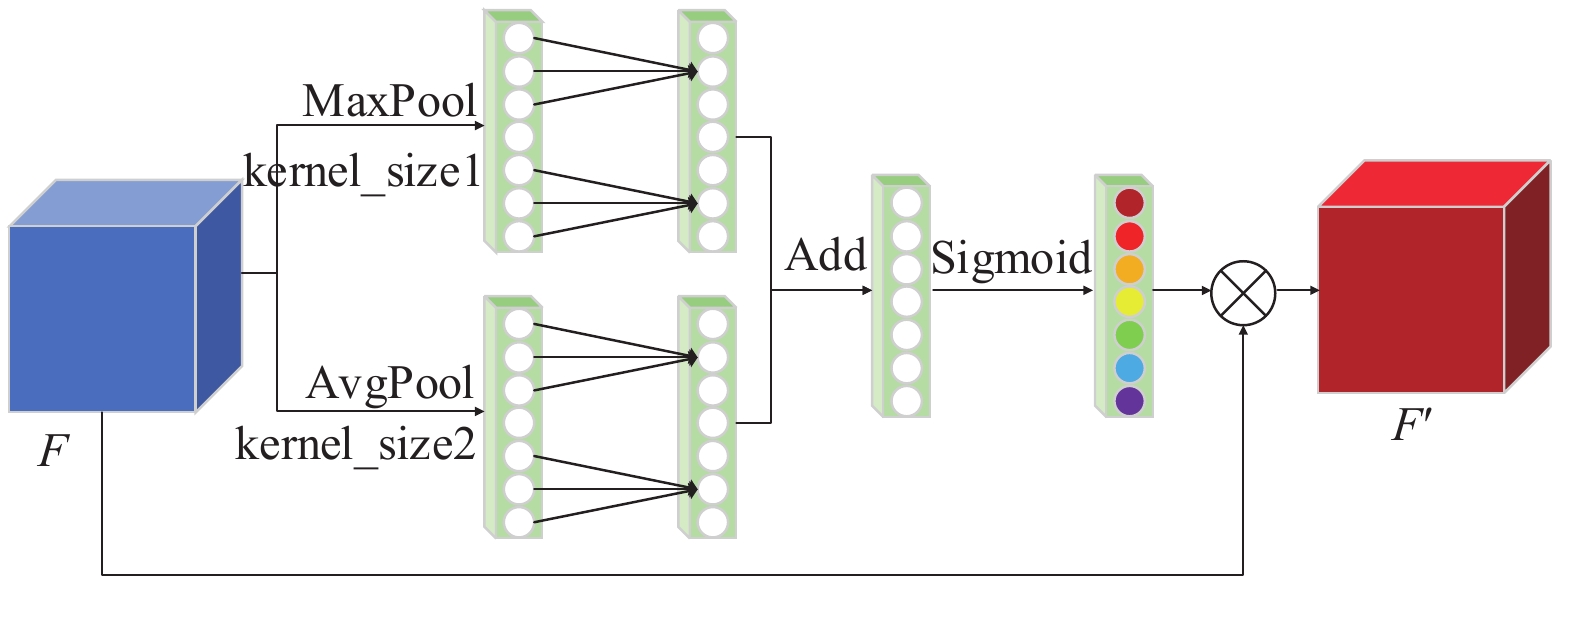
如图6所示,为了减少添加CBAM模块导致的增加模型参数量,在轻量化通道注意力模块(ECA)[26]基础之上,使用双分支轻量化通道注意力模块(E2CA)代替CAM提高模型对特征图通道的关注,最后与SAM组成轻量化混合注意力机制模块(E2CBAM),其模块结构表示为
![]() 图 6 混合注意力机制E2CBAM结构注:F表示原特征图;F'表示经过E2CA机制模块处理后的特征图;F"表示经过SAM模块处理后的特征图。Figure 6. Structure of hybrid attention mechanism E2CBAMNote: F represents the original feature map; F' represents the feature map after being processed by the E2CA mechanism module; F" represents the feature map after being processed by the SAM module.
图 6 混合注意力机制E2CBAM结构注:F表示原特征图;F'表示经过E2CA机制模块处理后的特征图;F"表示经过SAM模块处理后的特征图。Figure 6. Structure of hybrid attention mechanism E2CBAMNote: F represents the original feature map; F' represents the feature map after being processed by the E2CA mechanism module; F" represents the feature map after being processed by the SAM module.F′=Mc(F)⊗F,F″ (1) 式中 F 表示原特征图; F{'} 表示经过E2CA机制模块处理后的特征图; F{''}表示 F{'} 经过SAM模块处理后的特征图;{M_c}\left( F \right)为通道注意力图;{M_s}\left( F \right)为空间注意力图。
ECA使用1×1的卷积核代替全连接层,使得模型参数变小更加轻量。如图7所示,E2CA是由两个并行的ECA分支结构组成,首先将输入的特征图进行平均池化(最大池化),特征图从 \left[ {\boldsymbol{H},\boldsymbol{W},\boldsymbol{C}} \right] 的矩阵转变为 \left[ {\boldsymbol{1},\boldsymbol{1},\boldsymbol{C}} \right] 的特征向量;接着对特征图通道数进行计算得到自适应的一维卷积核的大小;然后利用计算得到的自适应卷积核进行一维卷积运算得到特征图每个通道对应的权重;最后使用归一化的权重值与原特征图在通道维度相乘得到通道加权后的特征图,实现流程表示为
![]() 图 7 E2CA模块结构注:kernel_sieze1、kernel_sieze2表示自适应卷积核;Sigmoid是激活函数;Add表示拼接操作。Figure 7. Structure of the E2CA moduleNote: kernel_sieze1, kernel_sieze2 represent adaptive convolution kernels; Sigmoid is the activation function; Add represents the concat operation.
图 7 E2CA模块结构注:kernel_sieze1、kernel_sieze2表示自适应卷积核;Sigmoid是激活函数;Add表示拼接操作。Figure 7. Structure of the E2CA moduleNote: kernel_sieze1, kernel_sieze2 represent adaptive convolution kernels; Sigmoid is the activation function; Add represents the concat operation.{M_c}\left( F \right) = {\text{σ }}({{\text{F}}_{conv1D}}\left( {{\text{AvgPool}}\left( x \right) + {\text{MaxPool}}\left( x \right)} \right) (2) 式中{\text{σ }}表示Sigmoid激活函数;{{\text{F}}_{conv1D}}表示自适应一维卷积变换;AvgPool和MaxPool分别表示平均池化和最大池化。自适应卷积核的大小计算式如下:
k = \varphi \left( c \right) = \left| {\frac{{\log _2^C}}{\gamma } + \frac{b}{\gamma }} \right|odd (3) 式中k表示卷积核大小,c表示特征图通道数,\left| . \right|odd表示取表达式最近的奇数值。将\gamma 和b分别设置为2和1用于改变特征图通道数c和自适应卷积核大小之间的比例关系。
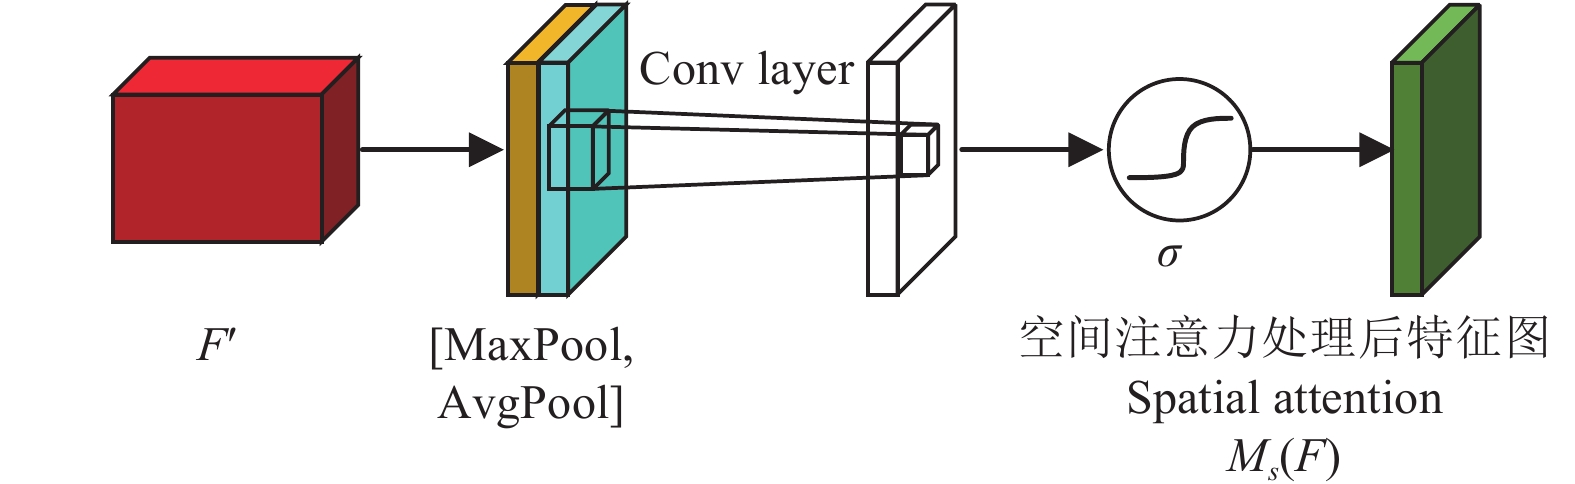
如图8所示,SAM首先将输入的特征图分别经过最大池化和平均池化层在通道维度生成两个 \left[ {\boldsymbol{1},\boldsymbol{H},\boldsymbol{W}} \right] 的权重向量;接着对两个特征向量进行Concat拼接得到 \left[ {\boldsymbol{2},\boldsymbol{H},\boldsymbol{W}} \right] 的特征空间权重;然后经过卷积核大小为7×7的卷积层将特征图维度变为 \left[ {\boldsymbol{1},\boldsymbol{H},\boldsymbol{W}} \right] ,得到通道维度的空间权重;最后利用Sigmoid对空间权重归一化后与原图相乘,对空间位置特征进行加权得到新的特征图 \left[ {\boldsymbol{C},\boldsymbol{H},\boldsymbol{W}} \right] ,以上操作表示为
![]() 图 8 SAM模块结构注:Conv layer表示7×7的卷积层;σ表示Sigmoid激活函数。Figure 8. Structure of the SAM(Spatial attention module)Note: Conv layer represents a 7×7 convolutional layer; σ represents a Sigmoid activation function.
图 8 SAM模块结构注:Conv layer表示7×7的卷积层;σ表示Sigmoid激活函数。Figure 8. Structure of the SAM(Spatial attention module)Note: Conv layer represents a 7×7 convolutional layer; σ represents a Sigmoid activation function.{M_s}\left( F \right) = {\text{σ }}\left( {{f^{7 \times 7}}\left( {\left[ {{\text{AvgPool}}\left( F \right);{\text{MaxPool}}\left( F \right)} \right]} \right)} \right) (4) 式中{f^{7 \times 7}}表示卷积核大小为7×7的卷积运算。
1.2.3 柔性非极大值抑制算法
在田野环境中,麦穗分布密集且互相遮挡导致漏检情况比较多。传统的非极大值抑制算法NMS将预测框之间交并比大于所设阈值的其他预测框全部过滤,例如当两个麦穗之间重叠程度较高时,非极大值抑制算法NMS则会去除其中一个预测框从而导致另一个目标被漏检,NMS计算式如下:
{s_i} = \left\{ {\begin{array}{*{20}{c}} {{s_i},}&{\mathrm{iou}(M,{b_i}) < {N_t}} \\ {0,}&{\mathrm{iou}(M,{b_i}) \geqslant {N_t}} \end{array}} \right. (5) 式中{s_i}表示第i个预测框的得分,M为得分最高的预测框,{b_i}表示第i个预测框,{N_t}是所设预测框交并比阈值,iou表示M 与bi的交并比值。
柔性非极大值抑制算法(Soft-NMS,soft-non maximum suppression)采用更加柔和的边界框筛选算法,在对目标预测框重叠程度较高且超过所设阈值时,通过对目标预测框使用高斯加权修改其置信度值来保留该预测框而不是直接将其过滤,有效减少了目标重叠导致边界框被过滤导致的漏检问题,进而提高模型针对密集小目标的检测能力,Soft-NMS计算式如下:
{s_i} = \left\{ {\begin{array}{*{20}{c}} {{s_i},}&{\mathrm{iou}(M,{b_i}) < {N_t}} \\ {{s_i}(1 - \mathrm{iou}(M,{b_i})),}&{\mathrm{iou}(M,{b_i}) \geqslant {N_t}} \end{array}} \right. (6) 在Soft-NMS算法中,置信度高斯加权计算式如下:
{s_i} = {s_i}{\mathrm{e}^{ - \frac{{\mathrm{iou}{{(M,{b_i})}^2}}}{\partial }}},\forall {b_i} \notin D (7) 式中\partial 为高斯权重。Soft-NMS对超过阈值的重叠预测框采用“惩罚”方式对其重新赋置信度值而不是将其过滤。
1.3 模型的训练与试验
1.3.1 评价指标
本试验使用平均精度(average precision,AP)、平均精度均值(mean average precision, mAP)、模型参数量(parameters)以及计算量对模型性能进行评价,其中计算值需要先计算模型训练的准确率(precision, P)及召回率(recall, R)。
1.3.2 试验环境及训练参数
试验输入图片尺寸为1 024×1 024像素,模型训练超参数具体设置如下:优化器选择使用随机梯度下降法SGD并采用Momentum优化算法,其中动量衰减项设置为0.9,权重衰减因子默认为0.000 1,初始学习率设置为0.005,24轮次之后降为0.000 5,32轮次之后降为0.000 05,38轮次后降为0.000 001,共训练40轮次。
试验的硬件设备主要配置为i7-12700F和显存16GB的NVIDIA GeForce RTX 4080 GPU。所使用的操作系统为Windows 11且装有Python3.7和Pytorch1.12.1的环境。
2. 结果与分析
2.1 颈网络改进模块试验
本试验以Oriented R-CNN模型为基础,在不改变模型其他参数及结构的情况下,训练模型至收敛,模型性能的试验结果见表2。
表 2 嵌入不同模块后模型检测精度对比Table 2. Comparison of model detection accuracy with different modulesPANet CBAM E2CBAM 平均精度均值
Mean average
precision
mAP/%
Parameters
Pa/M浮点计算量
Floating-point
operations
FLOPs/G× × × 85.77 41.13 198.54 √ × × 85.96 44.47 223.92 √ √ × 86.12 44.71 223.97 √ × √ 86.27 44.67 223.97 注:“×”表示未采用该模块;“√”表示采用该模块,下同。 Note: "x" indicates that the module has is not used; "√" indicates that the module is used, the same as below. 在颈网络中引入路径聚合网络PANet,mAP提高了0.19个百分点,在此基础之上分别嵌入了CBAM以及E2CBAM,mAP分别提高了0.16和0.31个百分点,参数量分别上涨了0.24和0.20 M,模型浮点数计算量基本不发生变化。相较于CBAM,E2CBAM在计算量基本不变的前提下参数量不仅减少了0.04 M,并且mAP提高了0.15个百分点。
为了更直观地验证在颈网络中嵌入E2CBAM的优越性,在引入PANet的基础之上,利用热力图比较颈网络嵌入CBAM以及E2CBAM对麦穗目标特征的捕获能力,将颈网络输出特征图的c2层作为样本进行对比,试验结果如图9所示。
![]() 图 9 颈网络中嵌入不同注意力机制可视化结果Figure 9. Visualization results of different attention mechanisms embedded in the neck network
图 9 颈网络中嵌入不同注意力机制可视化结果Figure 9. Visualization results of different attention mechanisms embedded in the neck network由图9可知,加入PANet的颈网络在嵌入不同注意力模块后,网络对密集麦穗目标的特征信息捕获能力均有明显的提升,尤其在区分麦穗目标与背景上有了显著的提升。对比CBAM和E2CBAM,两种混合注意力机制能够有效将网络感兴趣目标范围控制在麦穗目标区域,但CBAM对于背景区域关注较少但对于目标区域的关注程度同样不高,而E2CBAM减少对背景区域的关注程度的同时,对目标区域的定位更加准确,证明了E2CBAM的优越性,所以研究采用E2CBAM模块增强模型对麦穗目标位置区域的关注程度。
2.2 改进模型消融试验
在Oriented R-CNN基础上,在主干网络Backbone中引入SPPCSPC模块增大感受野,增强模型对麦穗小目标的检测能力;在颈网络中添加PANet融合不同尺度的特征图,并嵌入E2CBAM模块使得模型更关注特征图中小目标位置,对麦穗目标定位更加准确;在筛选预测框时,采用Soft-NMS避免重叠的麦穗目标漏检。为验证3种改进策略对模型检测性能的作用,进行了消融试验,试验结果如表3所示。
表 3 改进模型消融试验结果Table 3. Ablation test results of the improved modelResNet+
SPPCSPCPANet+
E2CBAMSoft-NMS 精确率
Precision P/%
Recall R/%mAP/% × × × 65.69 90.60 85.77 √ × × 79.06 90.81 86.21 × √ × 82.09 90.29 86.27 × × √ 64.60 92.09 86.87 √ √ × 81.79 90.80 86.45 √ × √ 72.70 92.14 87.40 × √ √ 64.97 92.07 87.59 √ √ √ 72.50 92.54 87.79 由表3数据可知,采用原Oriented R-CNN模型,该模型在测试集上mAP为85.77%;在基准模型上在主干网络中使用SPPCSPC生成输出特征层P5,扩大了感受野使模型能够处理不同尺度的麦穗目标,mAP提高了0.44个百分点;在基准模型的基础上在颈网络中引入PANet,通过融合不同尺度的特征图丰富其所包含的特征信息,并在特征融合分支中加入E2CBAM模块,使得模型更关注麦穗目标位置区域,该改进策略使得模型mAP提高了0.50个百分点;在基准模型的基础上采用柔性非极大值抑制算法Soft-NMS,采用更友好的预测框筛选算法,有效避免了重叠麦穗漏检,mAP提高了1.10个百分点;分别将3种改进模块进行两两组合验证其组合有效性,相较于基准模型分别提高了0.68、1.63以及1.82个百分点;在基准模型的基础上嵌入3种改进模块,mAP最高,较原模型提高了2.02个百分点。通过消融试验证明3种改进模块均能够有效提高模型检测精度,并在共同使用时能够使得模型mAP达到最高值87.79%。
2.3 Oriented R-CNN改进前后试验结果
为了验证改进后模型在麦穗检测与计数任务中的表现,在测试集中7类麦穗样本(arvalis_1、arvalis_2、arvalis_3、ethz_1、inrae_1、rres_1、usask_1)中分别取20张图像,共计140张图像,这些样本在光照强度以及密集程度上存在差异以便更全面地评估改进后模型性能。原模型与改进后模型对比试验结果如图10所示,麦穗分布较为稀疏时,改进前后模型对麦穗的检测效果并无明显差距,两者都能较好的识别麦穗类别及位置;麦穗分布较为密集或环境明亮时,原模型在识别遮挡麦穗时出现漏检,而改进后的Oriented R-CNN模型检测效果有了明显提高;环境阴暗时,原模型在识别过程中出现漏检和误检,而改进后的Oriented R-CNN模型对麦穗的分类和定位能力均有所提高。
![]() 图 10 改进前后模型检测效果对比注:红色方框标记区域为漏检麦穗;蓝色圆圈标记为该麦穗的种类被误判;图中红色数字表示图片中麦穗总数;下同。Figure 10. Comparison of model detection effect before and after improvementNote: The red box marks the area where the wheat ear was missed; the blue circle marks the category of the ear that was misclassified; the number in red indicates the total number of ears in the picture; the same as blow.
图 10 改进前后模型检测效果对比注:红色方框标记区域为漏检麦穗;蓝色圆圈标记为该麦穗的种类被误判;图中红色数字表示图片中麦穗总数;下同。Figure 10. Comparison of model detection effect before and after improvementNote: The red box marks the area where the wheat ear was missed; the blue circle marks the category of the ear that was misclassified; the number in red indicates the total number of ears in the picture; the same as blow.在计数任务中,将预测框得分阈值设为0.7,成功地过滤了那些置信度较低的预测框。对比原Oriented R-CNN模型和改进后的模型麦穗预测结果,表4清晰展示了改进后的模型在试验中取得的显著优势。改进后的Oriented R-CNN模型所有类别麦穗计数总和的正确率超过90%。相较于原模型,改进后的模型计数准确率提高1.18个百分点,为实际应用提供了更可靠的结果。特别值得注意的是,针对arvalis_2类别,改进后的模型在计数正确率方面取得了显著的提升,比原模型高出5个多百分点,这突显了改进后模型在阴暗环境下检测性能的提高,为在复杂条件下的农田应用提供了更为精确的计数结果。
表 4 改进前后模型麦穗计数结果试验Table 4. Tests of modeled wheat count results before and after improvement麦穗种类
Wheat variety人工计数
Manual counting原模型
Original model改进后模型
Improved model计数
Counting准确率
Accuracy/%计数
Counting准确率
Accuracy/%arvalis_1 824 768 93.20 775 94.04 arvalis_2 389 303 77.89 325 83.55 arvalis_3 506 446 88.14 462 91.30 ethz_1 1469 1297 88.29 1314 89.45 inrae_1 371 348 93.80 345 92.99 rres_1 901 827 91.79 836 92.79 usask_1 614 549 89.41 541 88.11 总计Total 5074 4538 89.44 4598 90.62 2.4 不同检测模型的对比试验
将改进后的Oriented R-CNN模型与当前主流的5种旋转目标检测模型Gliding vertex[27]、R3 det[28]、Rotated Faster R-CNN[29]、S2anet[30]和Rotated Retinanet[31]进行对比试验,按照模型的训练策略分别训练5种模型,对比识别效果如图11所示,5种对比模型在检测图片边界目标时均出现漏检,因为边界附近麦穗目标通常是不完整,模型获取到的麦穗特征信息过少;此外,R3 det、Rotated Faster R-CNN以及Rotated Retinaent对重叠目标的检测效果也不理想,而改进后的Orieted R-CNN模型对于图像边界框附近的麦穗目标以及目标分布密集区域的遮挡麦穗均有着更强的识别能力,说明其对麦穗目标的特征提取能力更强,在实际的田野环境中具有更优异的检测精度。
表5为不同旋转目标检测模型性能指标对比,由表5可知,Gliding vertex、R3 det、Rotated Faster R-CNN、S2anet和Rotated Retinanet的mAP分别为82.80%、85.30%、83.85%、85.54%和83.67%,而改进的Oriented R-CNN模型mAP为87.79%,较其他5种对比模型分别提高了4.99、2.49、3.94、2.25和4.12个百分点。
表 5 不同模型试验结果对比Table 5. Comparison of test results of different models模型
ModelP/% R/% mAP/% Pa/M FLOPs/G 每秒帧数
Frames per second,
FPS/(帧·s−1)Gliding vertex 77.10 88.27 82.80 41.13 198.41 27.2 R3 det 21.66 90.46 85.30 41.72 331.72 16.6 Rotated Faster
R-CNN76.30 89.67 83.85 41.13 198.40 27.2 S2anet 34.54 90.91 85.54 38.56 196.81 22.7 Rotated Retinanet 27.64 89.96 83.67 41.13 198.54 20.1 Improved Oriented R-CNN 72.50 92.54 87.79 47.23 314.55 23.2 对比试验说明改进后模型在光照强度存在差异的田野环境中对分布不均匀且遮挡的麦穗目标有更好的识别能力,能够更好地满足实际麦穗检测与计数任务对模型精度的需求。
2.5 田野麦穗实例检测
将2020年4月份在南京白马镇所拍摄的麦穗图像输入改进模型,观察强光照、阴暗环境、麦穗分布密集和重叠的麦穗图像检测结果,如图12所示。检测结果为:强光照麦穗图像中35个麦穗检测到32个,误检1个;阴暗麦穗图像中30个麦穗检测到28个;密集麦穗图像中36个麦穗检测到35个;重叠麦穗图像中37个麦穗检测到35个;138个麦穗总计正确检测数量为130,计数准确率为94.20%。可知,改进后的Oriented R-CNN模型能够满足实际麦穗检测与计数任务需求,在阴暗、强光照、密集目标和遮挡等场景中表现良好。
3. 结 论
该研究改进Oriented R-CNN模型,满足田野复杂环境下的麦穗目标检测与计数,主要结论如下:
1)在主干网络ResNet中引入SPPCSPC金字塔模块生成主干网络输出层F5,通过最大池化操作,能够使模型处理不同尺度的感受野对象,对于麦穗目标有更强的检测能力,模型的mAP提高了0.44个百分点。
2)在颈网络FPN中加入路径聚合网络PANet并在特征融合分支中添加E2CBAM注意力模块,路径聚合网络通过添加自底向上的特征融合通道进一步丰富了特征图包含的特征信息,E2CBAM模块使模型注重对特征图通道分配关系,同时减少了对非重点的背景区域的关注,颈网络整体改进使得模型mAP提高0.50个百分点。
3)使用Soft-NMS算法优化模型预测框筛选过程,避免漏检。本文改进的Oriented R-CNN最终平均精度均值mAP为87.79%,与主流的旋转目标检测模型Gliding vertex、R3 det、Rotated Faster R-CNN、S2anet和Rotated Retinanet相比,mAP分别提高了4.99、2.49、3.94、2.25和4.12个百分点,能够较好满足实际麦穗检测与计数任务对检测模型精度的需求。
-
![]()
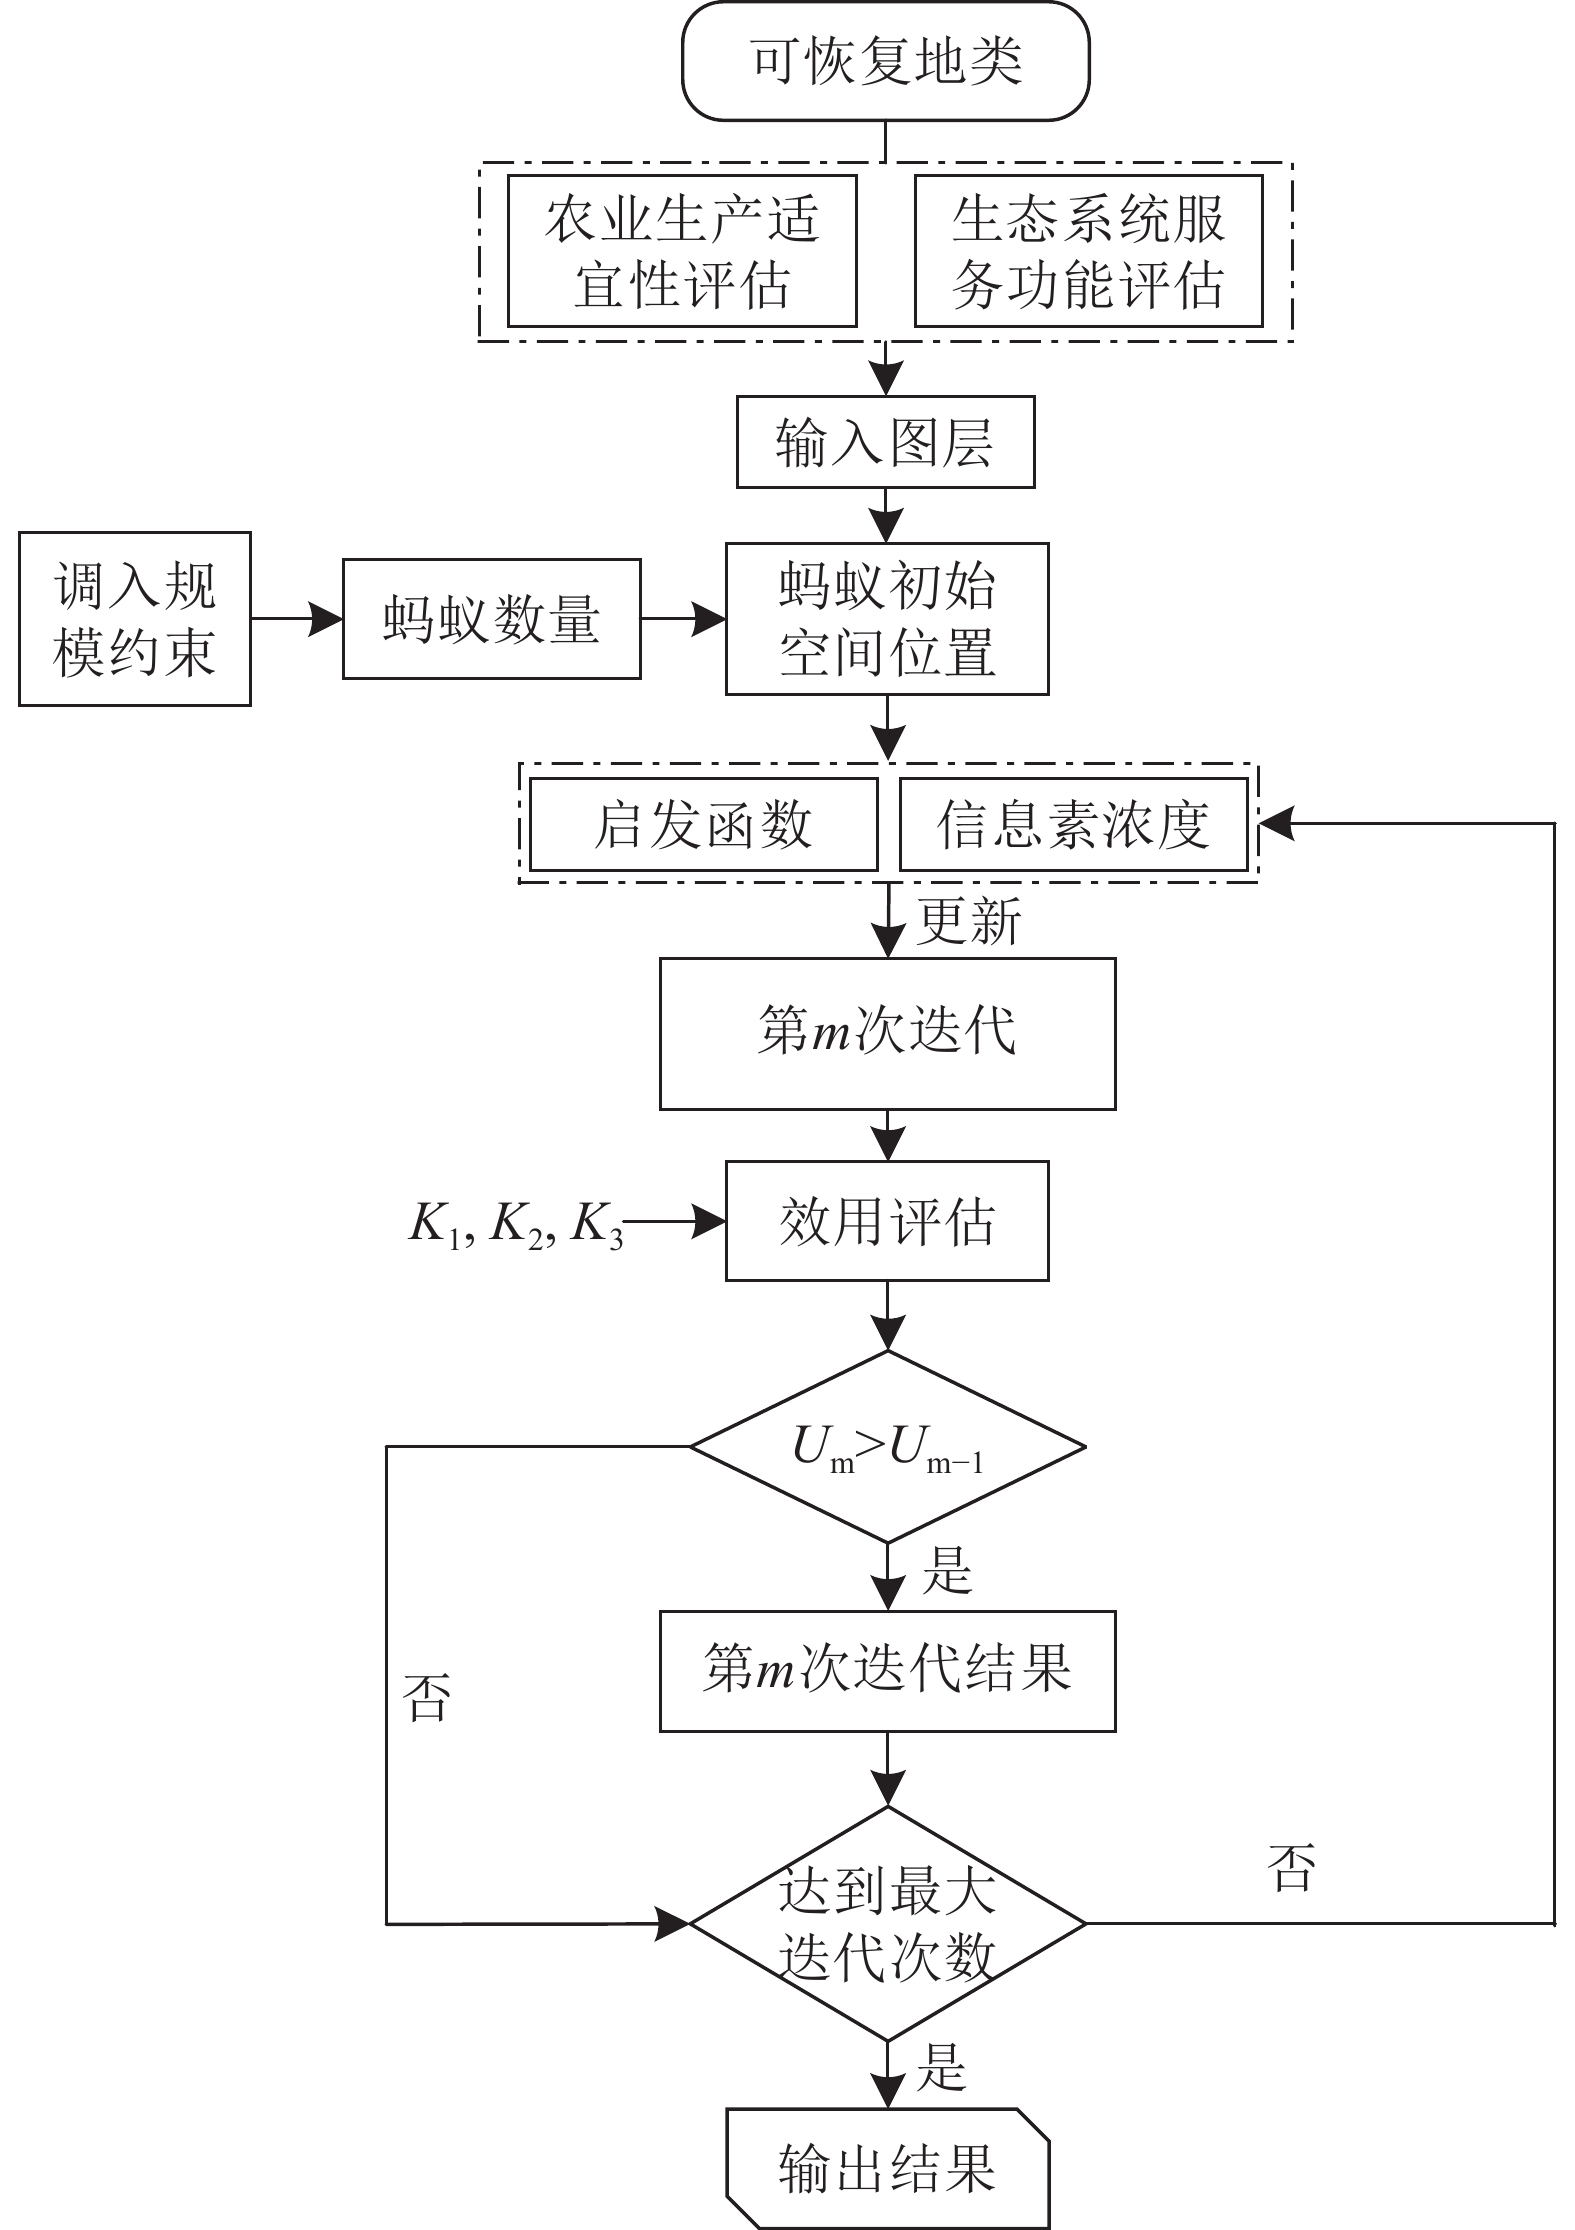
图 3 基于ACO算法的可恢复地类筛选过程
Figure 3. Process for selecting restored land cells using ACO algorithm
![]()
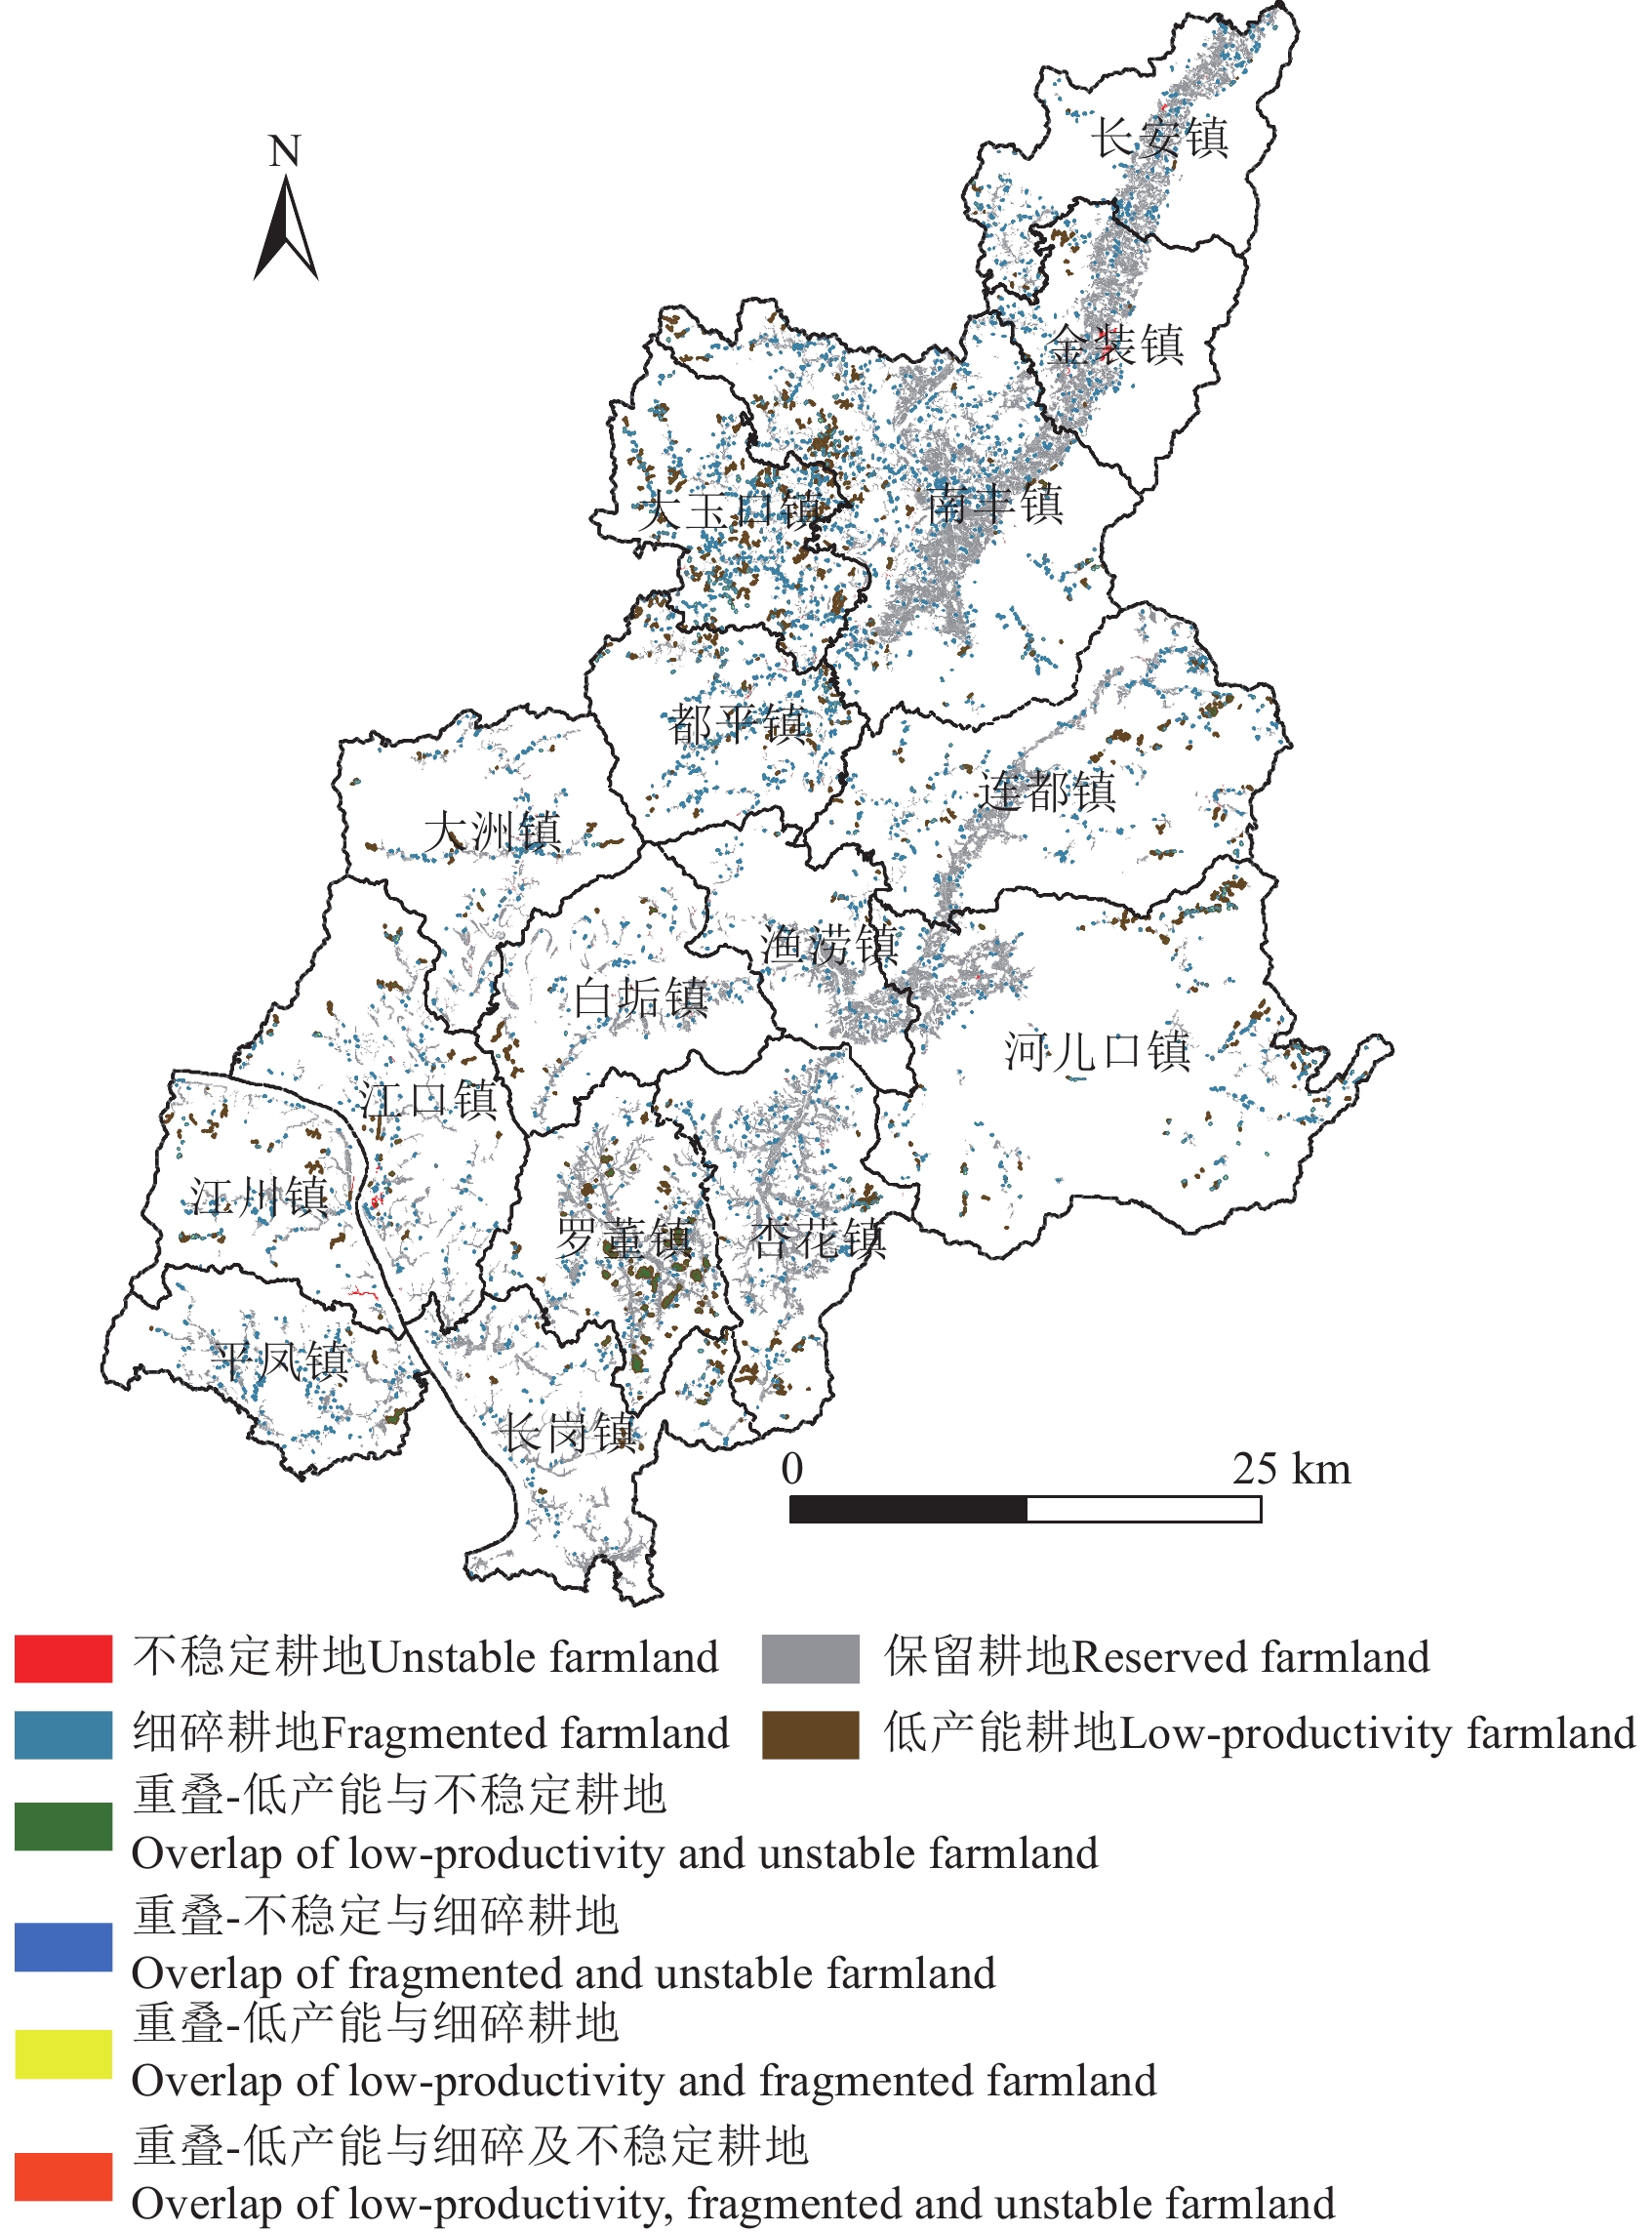
图 4 调出耕地空间分布及数量
Figure 4. Spatial distribution and quantity of farmland transferred out
![]()
图 5 可恢复地类农业生产适宜性空间分布
Figure 5. Spatial distribution of agricultural production suitability of restored land
![]()
图 6 可恢复地类综合生态系统服务重要性空间分布
Figure 6. Spatial distribution of the importance of integrated ecosystem service of restored land
![]()
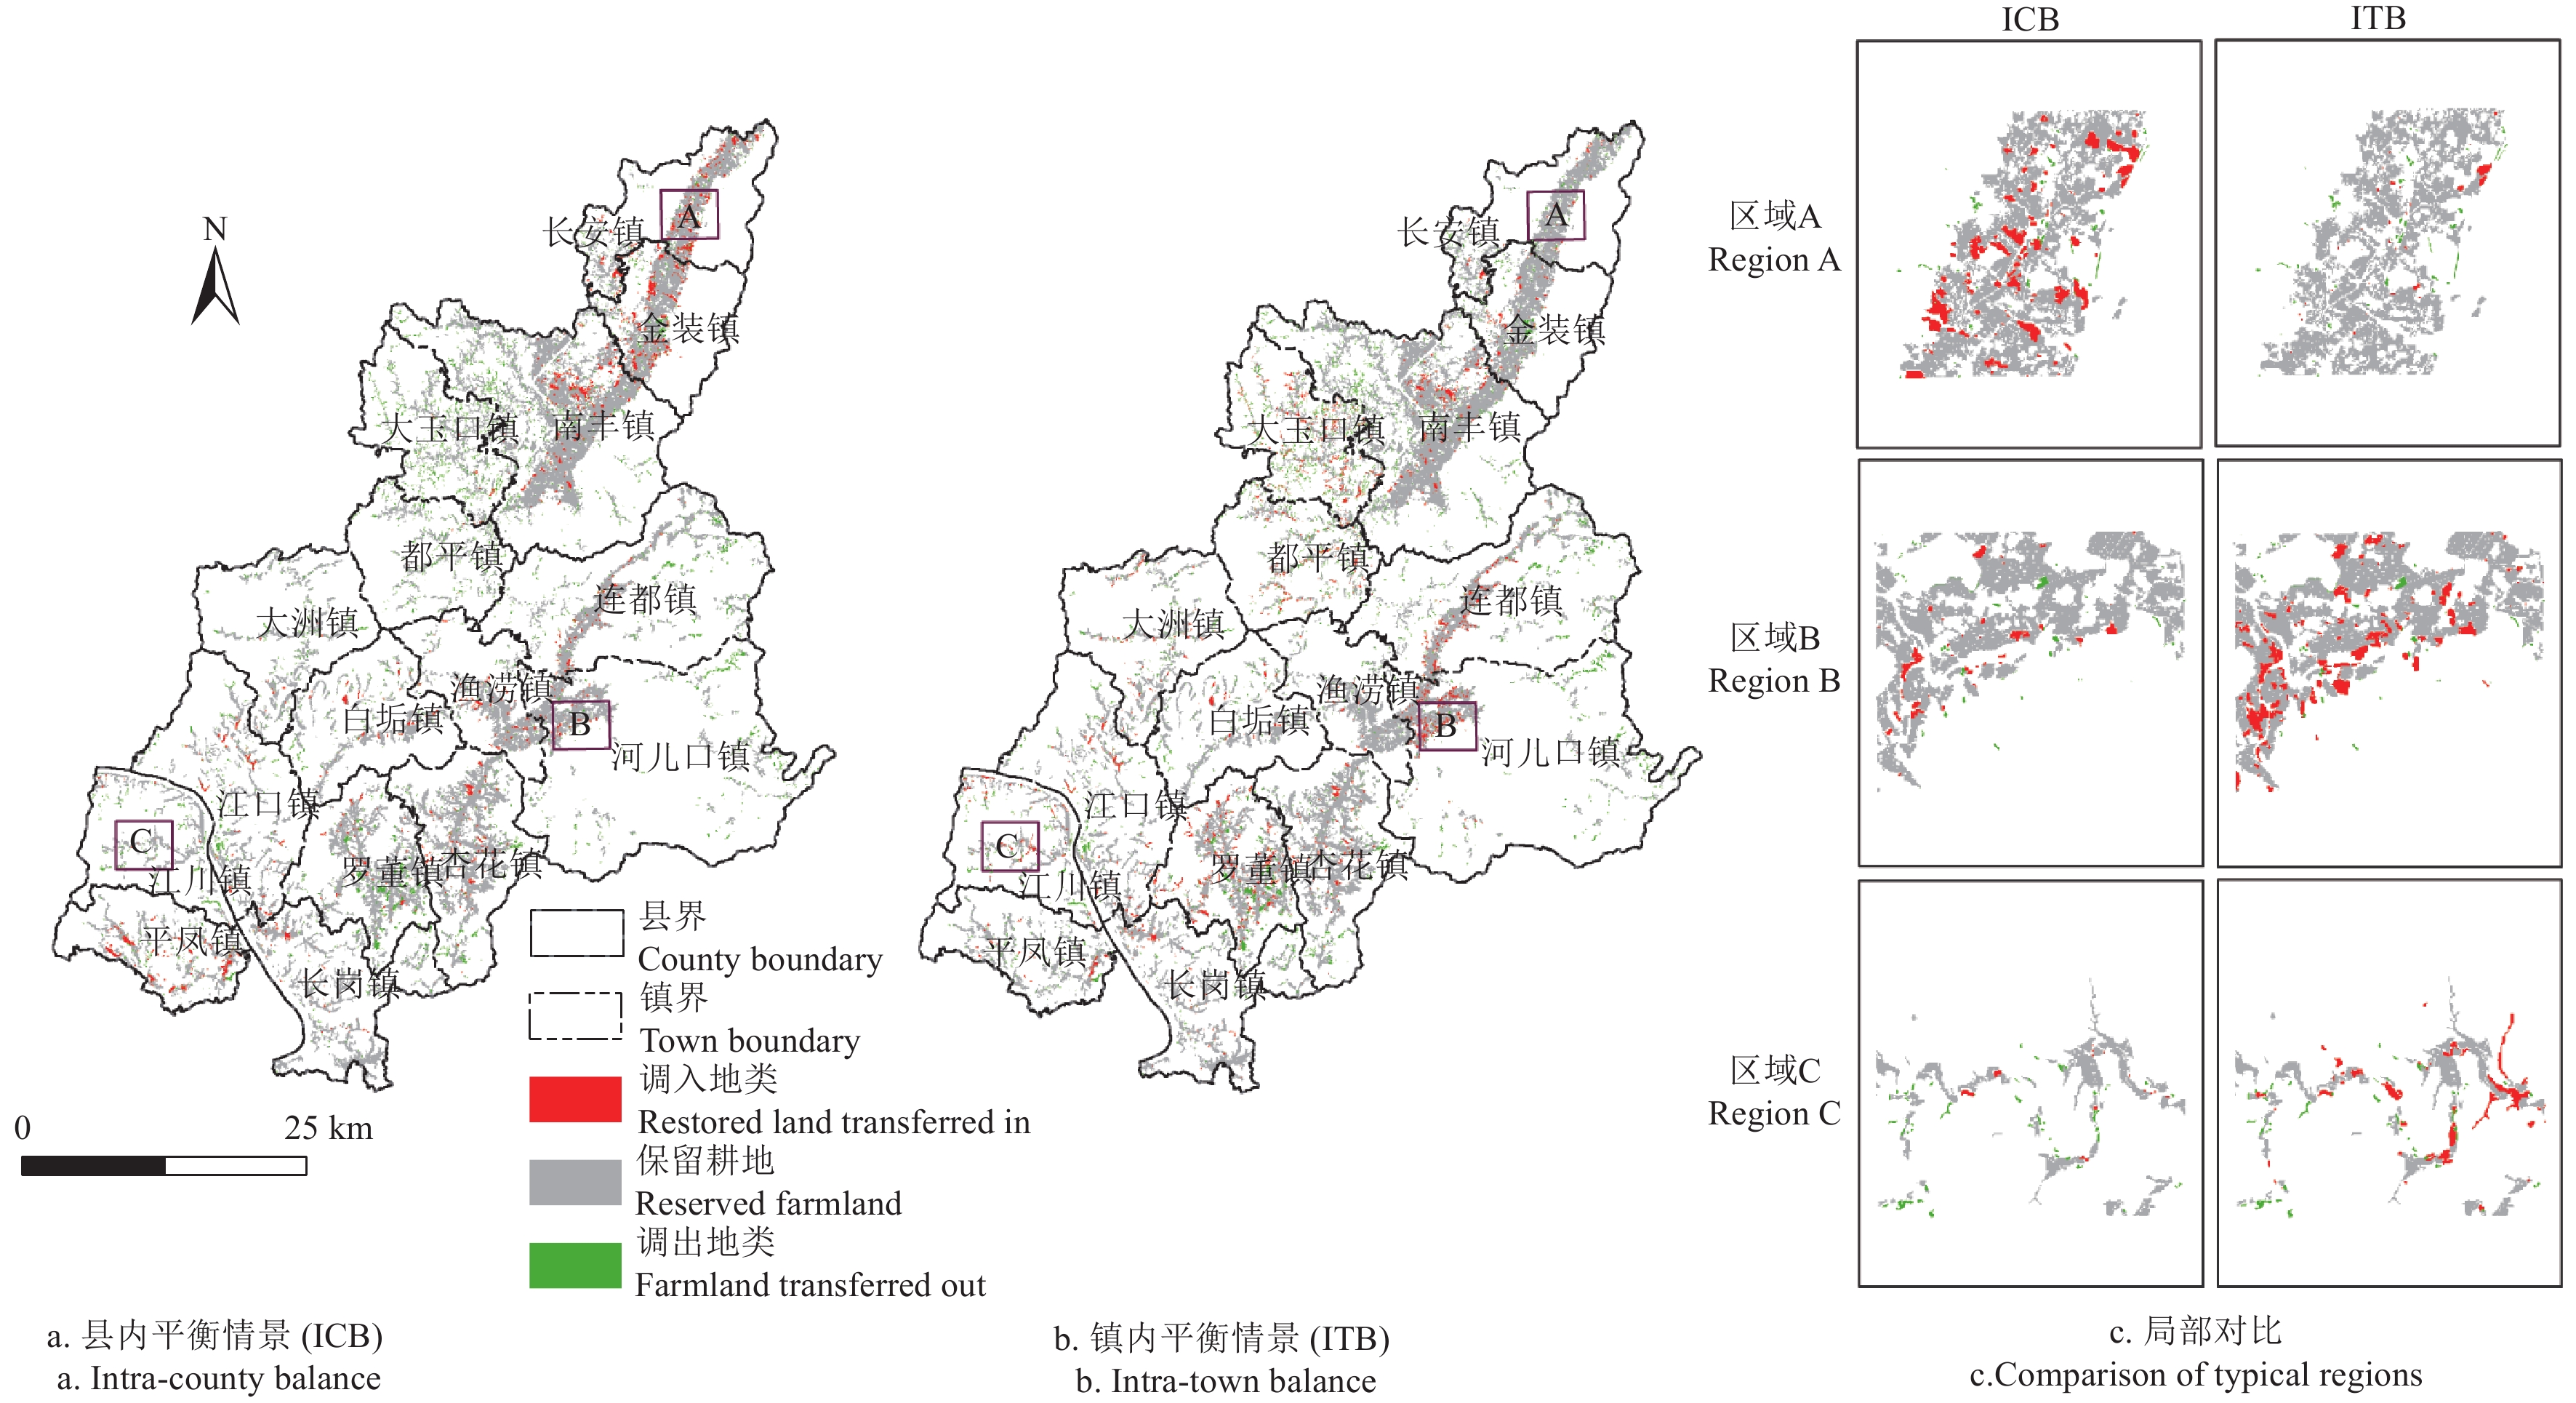
图 7 两种情景下耕地布局优化结果
Figure 7. Optimization results of farmland layout under two scenarios
![]()
图 8 两种情景下转入地类类型与面积
注:转入面积的单位为hm2。
Figure 8. Type and area of restored land that has been transferred in under the two scenarios
Note: The unit of transferred area is hm2.
表 1 农业生产适宜性评价指标体系
Table 1 Indicator system for evaluating the agricultural production suitability
准则层
Criterion layer因素层
Factor layer指标层
Indicator layer量化方法
Quantization method权重
Weight W质量
Quality
(W=0.42)土壤特性Qs 土壤有机质含量 叠加耕地资源质量分类数据库 0.12 土壤pH 叠加耕地资源质量分类数据库 0.04 土壤质地 叠加耕地资源质量分类数据库 0.08 土层厚度 叠加耕地资源质量分类数据库 0.10 立地条件Qt 坡度 叠加耕地资源质量分类数据库 0.13 高程 基于GIS统计图斑的平均高程 0.07 耕作条件Qf 耕作距离 基于GIS计算图斑到农村居民点的距离 0.06 道路可达性 { {R} }_{ {AI} }{=}\sum {N}·{ {G} }_{ {R} } ,式中RAI表示第I个图斑的道路可达性分值;
N表示连接的道路数量;GR表示连接的道路等级0.10 规整度 { {E} }_{ {I} }{=}{L}/{4}\sqrt{ {S} } , 式中EI表示第I个图斑的规整度; L表示图斑周长(m);
S表示图斑面积(m2)0.08 灌排条件Qd 距水源地距离 基于GIS计算图斑到水源地的距离 0.10 沟渠密度 图斑一定距离范围内的沟渠条数/图斑面积 0.12 稳定性
Stability
(W=0.28)灾毁风险Sc 地质灾害易发程度 叠加地质灾害易发图 0.28 建设占用风险Sj 邻域建设占比 图斑一定距离范围内的建设用地面积/图斑面积 0.32 与城镇距离 基于GIS计算图斑到城镇的距离 0.24 污染风险Sp 土壤重金属污染情况 叠加耕地资源质量分类数据库 0.16 连片性
Spatial connectivity (W=0.30)— — 若可恢复地类图斑与耕地有公共边:SCI=D;若无公共边: SCI=S。式中SCI表示
第I个图斑的连片分值;D表示与耕地的连片面积 (m2)1.00  下载: 导出CSV
表 2 各镇调出耕地面积与比例
Table 2 Area and ratio of farmland transferred out of towns
乡镇
Town耕地面积
Area of farmland/hm2调出耕地
Farmland transferred out面积Area /hm2 比例Ratio /% 白垢镇Baigou Town 777.79 45.80 5.89 大玉口镇Dayukou Town 586.08 173.77 29.65 大洲镇Dazhou Town 656.71 57.04 8.69 都平镇Duping Town 432.73 92.07 21.28 河儿口镇He’erkou Town 1560.10 162.32 10.40 江川镇Jiangchuan Town 583.81 81.36 13.94 江口镇Jiangkou Town 841.89 97.96 11.64 金装镇Jinzhuang Town 1658.60 68.72 4.14 连都镇Liandu Town 1658.59 146.35 8.82 罗董镇Luodong Town 2042.69 264.53 12.95 南丰镇Nanfeng Town 4437.68 221.32 4.99 平凤镇Pingfeng Town 670.11 52.76 7.87 杏花镇Xinghua Town 2256.91 103.22 4.57 渔涝镇Yulao Town 1128.59 22.49 1.99 长安镇Chang’an Town 1576.06 49.83 3.16 长岗镇Chang’gang Town 1297.86 50.35 3.88
下载: 导出CSV
表 3 各镇调入耕地面积与比例
Table 3 Area and ratio of farmland transferred in of towns
乡镇
Town可恢复
地类面积
Area of restored
land/hm2ICB ITB 调入面积
Area of
transferred
in /hm2比例
Ratio/%调入面积
Area of
transferred
in/hm2比例
Ratio/%白垢镇 269.04 66.14 24.58 45.80 17.02 大玉口镇 325.35 21.52 6.61 173.77 53.41 大洲镇 236.01 8.26 3.50 57.04 24.17 都平镇 233.96 4.48 1.91 92.07 39.35 河儿口镇 526.34 33.66 6.40 162.32 30.84 江川镇 251.62 11.36 4.51 81.36 32.33 江口镇 308.57 92.04 29.83 97.96 31.75 金装镇 1 323.77 300.22 22.68 68.72 5.19 连都镇 404.96 72.62 17.93 146.35 36.14 罗董镇 424.31 59.65 14.06 264.53 62.34 南丰镇 1 602.85 287.89 17.96 221.32 13.81 平凤镇 973.96 187.68 19.27 52.76 5.42 杏花镇 572.96 121.95 21.28 103.22 18.02 渔涝镇 366.29 83.32 22.75 22.49 6.14 长安镇 1 016.63 294.60 28.98 49.83 4.90 长岗镇 370.83 44.50 12.00 50.35 13.58
下载: 导出CSV
-
[1] CUI K, SHOEMAKER S P. A look at food security in China[J]. npj Science of Food, 2018, 2(1): 4. doi: 10.1038/s41538-018-0012-x
[2] 慕正隆,石培基,刘春芳,等. 基于形态优化和边界识别的基本农田保护区研究[J]. 资源科学,2018,40(1):22-31. MU Zhenglong, SHI Peiji, LIU Chunfang, et al. Basic farmland protection area based on morphological optimization and boundary identification[J]. Resources Science, 2018, 40(1): 22-31. (in Chinese with English abstract)
[3] CHEN H, MENG F, YU Z, et al. Spatial–temporal characteristics and influencing factors of farmland expansion in different agricultural regions of Heilongjiang Province, China[J]. Land Use Policy, 2022, 115: 106007. doi: 10.1016/j.landusepol.2022.106007
[4] 孔祥斌,陈文广,党昱譞. 中国耕地保护现状、挑战与转型[J]. 湖南师范大学社会科学学报,2023,52(5):31-41. KONG Xiangbin, CHEN Wenguang, DANG Yuxuan. Current situation, challenges and transformation of cultivated land protection in China[J]. Journal of Social Science of Hunan Normal University, 2023, 52(5): 31-41. (in Chinese with English abstract)
[5] 刘金花,王雨晴,蒋海明,等. 进出平衡视角下耕地恢复潜力重点区域识别[J]. 农业工程学报,2023,39(12):216-225. LIU Jinhua, WANG Yuqing, JIANG Haiming, et al. Identifying the key regions of potential arable land restoration from the perspective of in-out balance[J]. Transactions of the Chinese Society of Agricultural Engineering (Transactions of the CSAE), 2023, 39(12): 216-225. (in Chinese with English abstract)
[6] 袁承程,张定祥,刘黎明,等. 近10年中国耕地变化的区域特征及演变态势[J]. 农业工程学报,2021,37(1):267-278. YUAN Chengcheng, ZHANG Dingxiang, LIU Liming, et al. Regional characteristics and spatial-temporal distribution of cultivated land change in China during 2009-2018[J]. Transactions of the Chinese Society of Agricultural Engineering (Transactions of the CSAE), 2021, 37(1): 267-278. (in Chinese with English abstract)
[7] XU W, JIN X, LIU J, et al. Analysis of influencing factors of cultivated land fragmentation based on hierarchical linear model: A case study of Jiangsu Province, China[J]. Land Use Policy, 2021, 101: 105119. doi: 10.1016/j.landusepol.2020.105119
[8] 韩述,郭贯成,史洋洋,等. 基于国土空间“三线”划定与耕地质量自相关的耕地空间布局优化[J]. 农业工程学报,2022,38(19):237-248. HAN Shu, GUO Guancheng, SHI Yangyang, et al. Optimization of the spatial layout of arable land protection using "Three Lines" delineation of territorial spatial planning and spatial autocorrelation attributes of arable land quality[J]. Transactions of the Chinese Society of Agricultural Engineering (Transactions of the CSAE), 2022, 38(19): 237-248. (in Chinese with English abstract)
[9] 贺勇. 浙江省“山上”换“山下”优化耕地布局的实践和思考[J]. 中国土地,2023(10):5-7. [10] 龚媛,李飞雪,王丽妍,等. 耕地空间优化配置研究——以常州市新北区为例[J]. 水土保持研究,2016,23(4):199-205. GONG Yuan, LI Feixue, WANG Liyan, et al. Studies on spatial optimization allocation of cultivated land: Taking Xinbei District, Changzhou City as the example[J]. Research of Soil and Water Conservation, 2016, 23(4): 199-205. (in Chinese with English abstract)
[11] 关小克,张凤荣,郭力娜,等. 北京市耕地多目标适宜性评价及空间布局研究[J]. 资源科学,2010,32(3):580-587. GUAN Xiaoke, ZHANG Fengrong, GUO Lina, et al. A suitability evaluation of cultivated land in Beijing for multi-purposes use and its spatio-temporal investigation[J]. Resources Science, 2010, 32(3): 580-587. (in Chinese with English abstract)
[12] CHEN L, ZHAO H, SONG G, et al. Optimization of cultivated land pattern for achieving cultivated land system security: A case study in Heilongjiang Province, China[J]. Land Use Policy, 2021, 108: 105589. doi: 10.1016/j.landusepol.2021.105589
[13] SONG G, ZHANG H. Cultivated land use layout adjustment based on crop planting suitability: A case study of typical counties in Northeast China[J]. Land, 2021, 10(2): 107. doi: 10.3390/land10020107
[14] SONG Y, LU Y, LIU T, et al. Variation of vegetation fractional coverage and its relationship with climate in a desert steppe: optimization of farmland layout in a farming–pastoral ecotone using the ecological suitability index[J]. Ecological Engineering, 2020, 150: 105834. doi: 10.1016/j.ecoleng.2020.105834
[15] LI C, WANG X, JI Z, et al. Optimizing the use of cultivated land in China’s main grain-producing areas from the dual perspective of ecological security and leading-function zoning[J]. International Journal of Environmental Research and Public Health, 2022, 19(20): 13630. doi: 10.3390/ijerph192013630
[16] WANG L, ZHENG W, TANG L, et al. Spatial optimization of urban land and cropland based on land production capacity to balance cropland protection and ecological conservation[J]. Journal of Environmental Management, 2021, 285: 112054. doi: 10.1016/j.jenvman.2021.112054
[17] LIU Q, NIU J, WOOD J D, et al. Spatial optimization of cropping pattern in the upper-middle reaches of the Heihe River basin, Northwest China[J]. Agricultural Water Management, 2022, 264: 107479. doi: 10.1016/j.agwat.2022.107479
[18] 柯新利,邓祥征,刘成武. 基于分区异步元胞自动机模型的耕地利用布局优化——以武汉城市圈为例[J]. 地理科学进展,2010,29(11):1442-1450. doi: 10.11820/dlkxjz.2010.11.044 KE Xinli, DENG Xiangzheng, LIU Chengwu. Interregional farmland layout optimization model based on the partition asynchronous cellular automata: A case study of the Wuhan City Circle[J]. Progress in Geography, 2010, 29(11): 1442-1450. (in Chinese with English abstract) doi: 10.11820/dlkxjz.2010.11.044
[19] 叶英聪,孙凯,匡丽花,等. 基于空间决策的城镇空间与农业生产空间协调布局优化[J]. 农业工程学报,2017,33(16):256-266. doi: 10.11975/j.issn.1002-6819.2017.16.034 YE Yingcong, SUN Kai, KUANG Lihua, et al. Spatial layout optimization of urban space and agricultural space based on spatial decision-making[J]. Transactions of the Chinese Society of Agricultural Engineering (Transactions of the CSAE), 2017, 33(16): 256-266. (in Chinese with English abstract) doi: 10.11975/j.issn.1002-6819.2017.16.034
[20] ZONG R, ZENG Y, FANG N, et al. Spatially optimized cropland distribution promotes sustainable farming and vegetation restoration in mountainous regions[J]. Land Degradation & Development, 2022, 33(18): 3954-3964.
[21] 李建国,曾柳絮. 耕地保护赋能乡村振兴的湖南实践[J]. 中国土地,2024(2):45-47. [22] 罗倩,张威,邵景安,等. 武陵山区县域尺度永久基本农田划定优化[J]. 中国农业资源与区划,2021,42(7):48-57. LUO Qian, ZHANG Wei, SHAO Jingan, et al. Optimization of permanent basic farmland delineation at county scale in Wuling mountain area[J]. Chinese Journal of Agricultural Resources and Regional Planning, 2021, 42(7): 48-57. (in Chinese with English abstract)
[23] 王玉军,刘琼,欧名豪. 基于地质环境适宜性的基本农田布局优化研究[J]. 农业工程学报,2019,35(14):252-260. WANG Yujun, LIU Qiong, OU Minghao. Optimization of prime farmland layout on basis of geological environment suitability[J]. Transactions of the Chinese Society of Agricultural Engineering (Transactions of the CSAE), 2019, 35(14): 252-260. (in Chinese with English abstract)
[24] 翁睿,金晓斌,张晓琳,等. 集成“适宜性-集聚性-稳定性”的永久基本农田储备区划定[J]. 农业工程学报,2022,38(2):269-278. WENG Rui, JIN Xiaobin, ZHANG Xiaolin, et al. Delimitating permanent prime farmland reserve areas on the perspective of suitability-cluster-stability[J]. Transactions of the Chinese Society of Agricultural Engineering (Transactions of the CSAE), 2022, 38(2): 269-278. (in Chinese with English abstract)
[25] 叶思菁,宋长青,程锋,等. 中国耕地健康产能综合评价与试点评估研究[J]. 农业工程学报,2019,35(22):66-78. doi: 10.11975/j.issn.1002-6819.2019.22.008 YE Sijing, SONG Changqing, CHENG Feng, et al. Cultivated land health-productivity comprehensive evaluation and its pilot evaluation in China[J]. Transactions of the Chinese Society of Agricultural Engineering (Transactions of the CSAE), 2019, 35(22): 66-78. (in Chinese with English abstract) doi: 10.11975/j.issn.1002-6819.2019.22.008
[26] TAN S, HEERINK N, QU F. Land fragmentation and its driving forces in China[J]. Land Use Policy, 2006, 23(3): 272-285. doi: 10.1016/j.landusepol.2004.12.001
[27] CHEN Y, YAO M, ZHAO Q, et al. Delineation of a basic farmland protection zone based on spatial connectivity and comprehensive quality evaluation: A case study of Changsha City, China[J]. Land Use Policy, 2021, 101: 105145. doi: 10.1016/j.landusepol.2020.105145
[28] 温良友,张青璞,孔祥斌,等. 基于产能与健康综合评价的北京大兴区耕地整治分区[J]. 农业工程学报,2019,35(22):79-89. WEN Liangyou, ZHANG Qingpu, KONG Xiangbin, et al. Arable land consolidation zoning based on comprehensive evaluation of capacity and health[J]. Transactions of the Chinese Society of Agricultural Engineering (Transactions of the CSAE), 2019, 35(22): 79-89. (in Chinese with English abstract)
[29] 刘敏,周健,胡月明,等. 基于XGBoost算法的可恢复耕地宜耕性评价——以湘阴县为例[J]. 农业资源与环境学报,2024,41(1):49-60. LIU Min, ZHOU Jian, HU Yueming, et al. Using XGBoost to evaluate arability on recoverable cultivated land: a case study of Xiangyin County[J]. Journal of Agricultural Resources and Environment, 2024, 41(1): 49-60. (in Chinese with English abstract)
[30] 王猛,提杨,王家栋,等. 不同土地利用情景下天津市生态系统服务及权衡与协同分析[J]. 北京林业大学学报,2022,44(5):77-85. WANG Meng, TI Yang, WANG Jiadong, et, al. Ecosystem services, trade-offs and synergy analysis in Tianjin under different land use scenarios[J]. Journal of Beijing Forestry University, 2022, 44(5): 77-85. (in Chinese with English abstract)
[31] ARUNYAWAT S, SHRESTHA R P. Assessing land use change and its impact on ecosystem services in Northern Thailand[J]. Sustainability, 2016, 8(8): 768. doi: 10.3390/su8080768
[32] 郑慧玲,郑辉峰. 基于土地利用/覆被动态变化的粤港澳大湾区碳储量评价与预测[J]. 环境科学,2024,45(4):2321-2331. ZHENG Huiling, ZHENG Huifeng. Assessment and prediction of carbon storage based on land use/land cover dynamics in the Guangdong-Hong Kong-Macao Greater Bay Area[J]. Environmental Science, 2024, 45(4): 2321-2331. (in Chinese with English abstract)
[33] LEH M D K, MATLOCK M D, CUMMINGS E C, et al. Quantifying and mapping multiple ecosystem services change in West Africa[J]. Agriculture, Ecosystems & Environment, 2013, 165: 6-18.
[34] LI X, LAO C, LIU X, et al. Coupling urban cellular automata with ant colony optimization for zoning protected natural areas under a changing landscape[J]. International Journal of Geographical Information Science, 2011, 25(4): 575-593. doi: 10.1080/13658816.2010.481262
[35] LIU Y, LIU D, LIU Y, et al. Rural land use spatial allocation in the semiarid loess hilly area in China: Using a particle swarm optimization model equipped with multi-objective optimization techniques[J]. Science China Earth Sciences, 2012, 55(7): 1166-1177. doi: 10.1007/s11430-011-4347-2
[36] 柯新利,马才学. 基于资源禀赋和经济发展区域差异的耕地优化布局——以武汉城市圈为例[J]. 经济地理,2013,33(11):136-141,148. doi: 10.3969/j.issn.1000-8462.2013.11.022 KE Xinli, MA Caixue. Interregional farmland layout optimization on the constraint of natural resources and social-economical condition: A case study of Wuhan City circle[J]. Economic geography, 2013, 33(11): 136-141,148. (in Chinese with English abstract) doi: 10.3969/j.issn.1000-8462.2013.11.022
-
期刊类型引用(3)
1. 陈金荣,许燕,周建平,王小荣,罗鸣,徐声彪. 基于YOLO-SSAR的自然环境下红花检测算法. 农业工程学报. 2025(02): 215-223 .  本站查看
本站查看
2. 张洁,杨诚阳,邹佳琪,鲁兆宏,谭先明,杨峰. 基于计算机视觉的大豆与玉米种子计数方法研究. 四川农业大学学报. 2024(05): 1021-1027+1048 . 百度学术
3. 伍荣达,张世昂,付根平,陈天赐,赖颖杰,罗文轩,郭晓耿,朱立学. 基于旋转框定位的改进YOLOv7的香蕉目标检测与定位方法. 农业工程学报. 2024(22): 115-123 . 本站查看
其他类型引用(2)


计量
- 文章访问数: 270
- HTML全文浏览量: 22
- PDF下载量: 77
- 被引次数: 5