Factors affecting the non-destructive detection of water contents in fresh corn cobs by near-infrared spectroscopy
-
摘要:
为了获取鲜食玉米果穗高质量近红外光谱,该研究基于近红外漫反射光谱技术开展试验参数对鲜食玉米果穗光谱特征影响及建模验证探究。根据果穗棒状特征,搭建多维度综合试验装置,采集光源类型、光强大小、探测距离和光源角度共4类不同参数下的900~
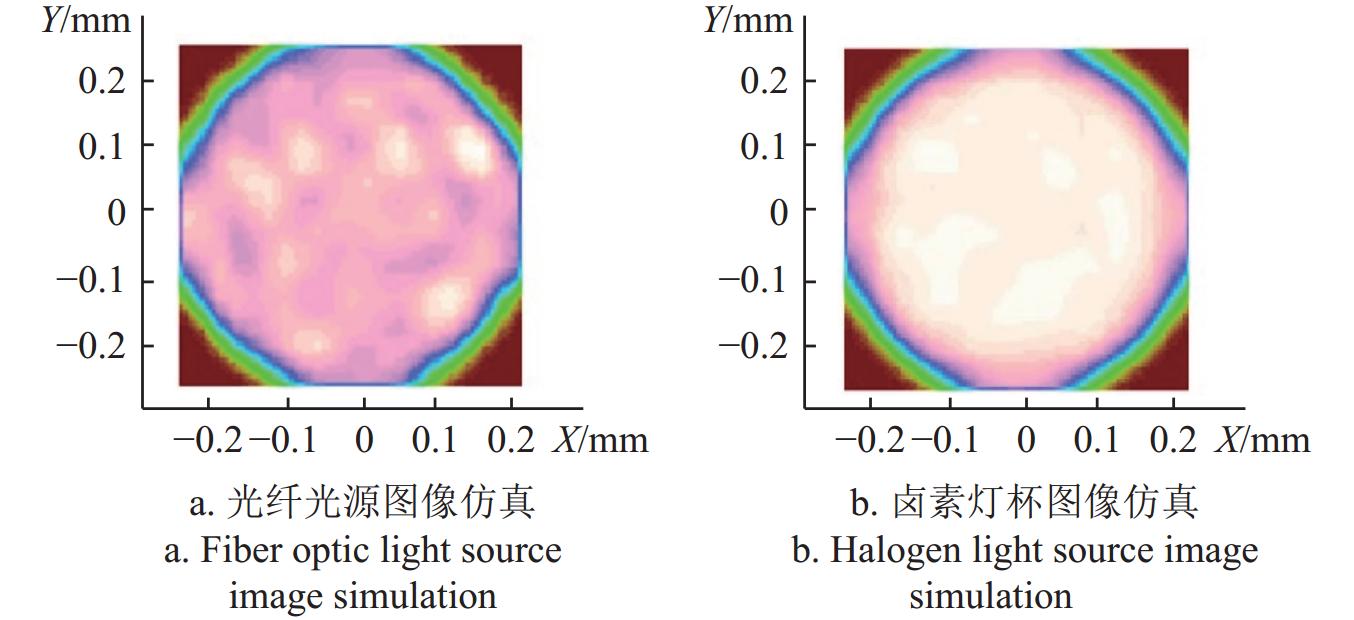
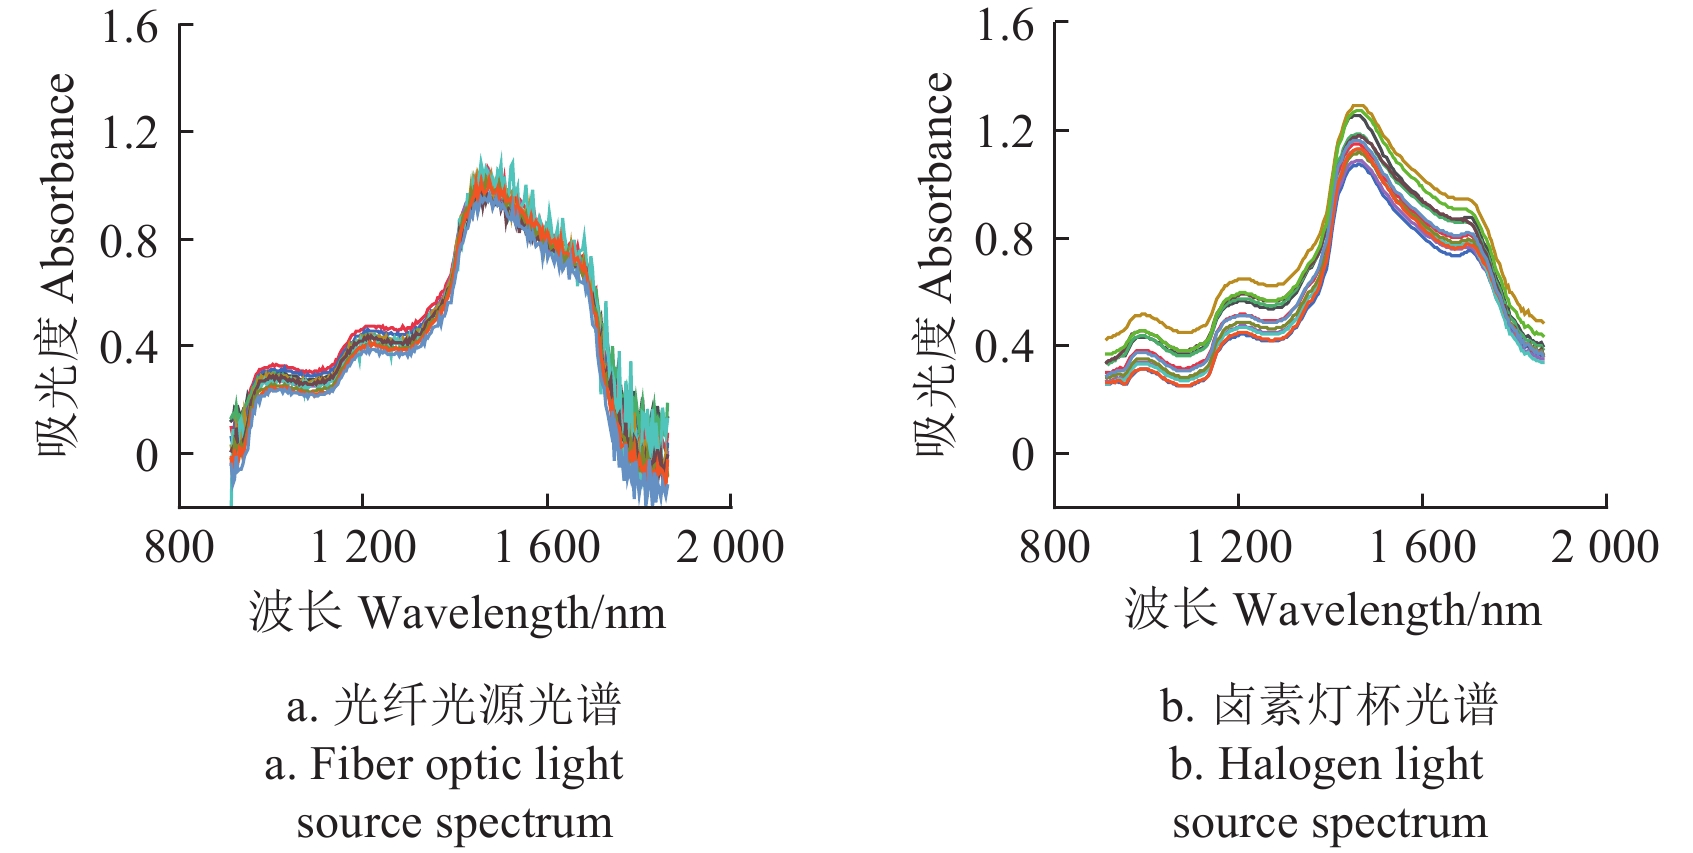
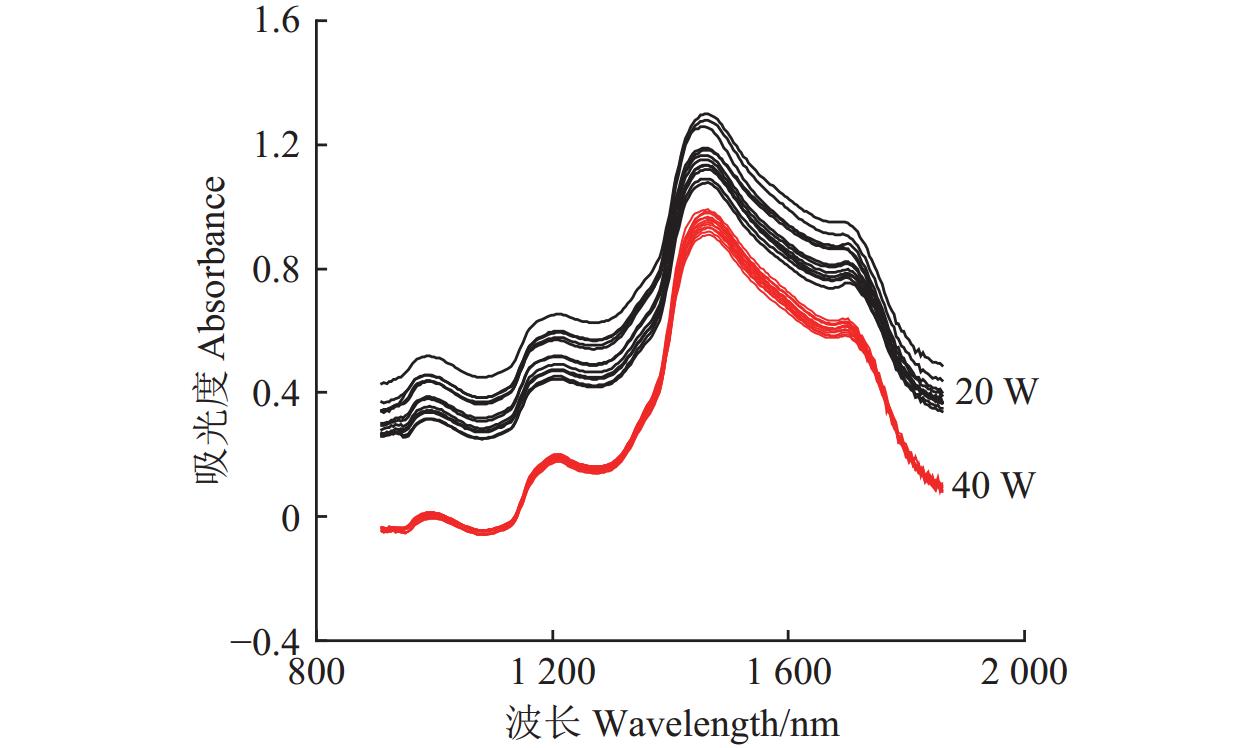
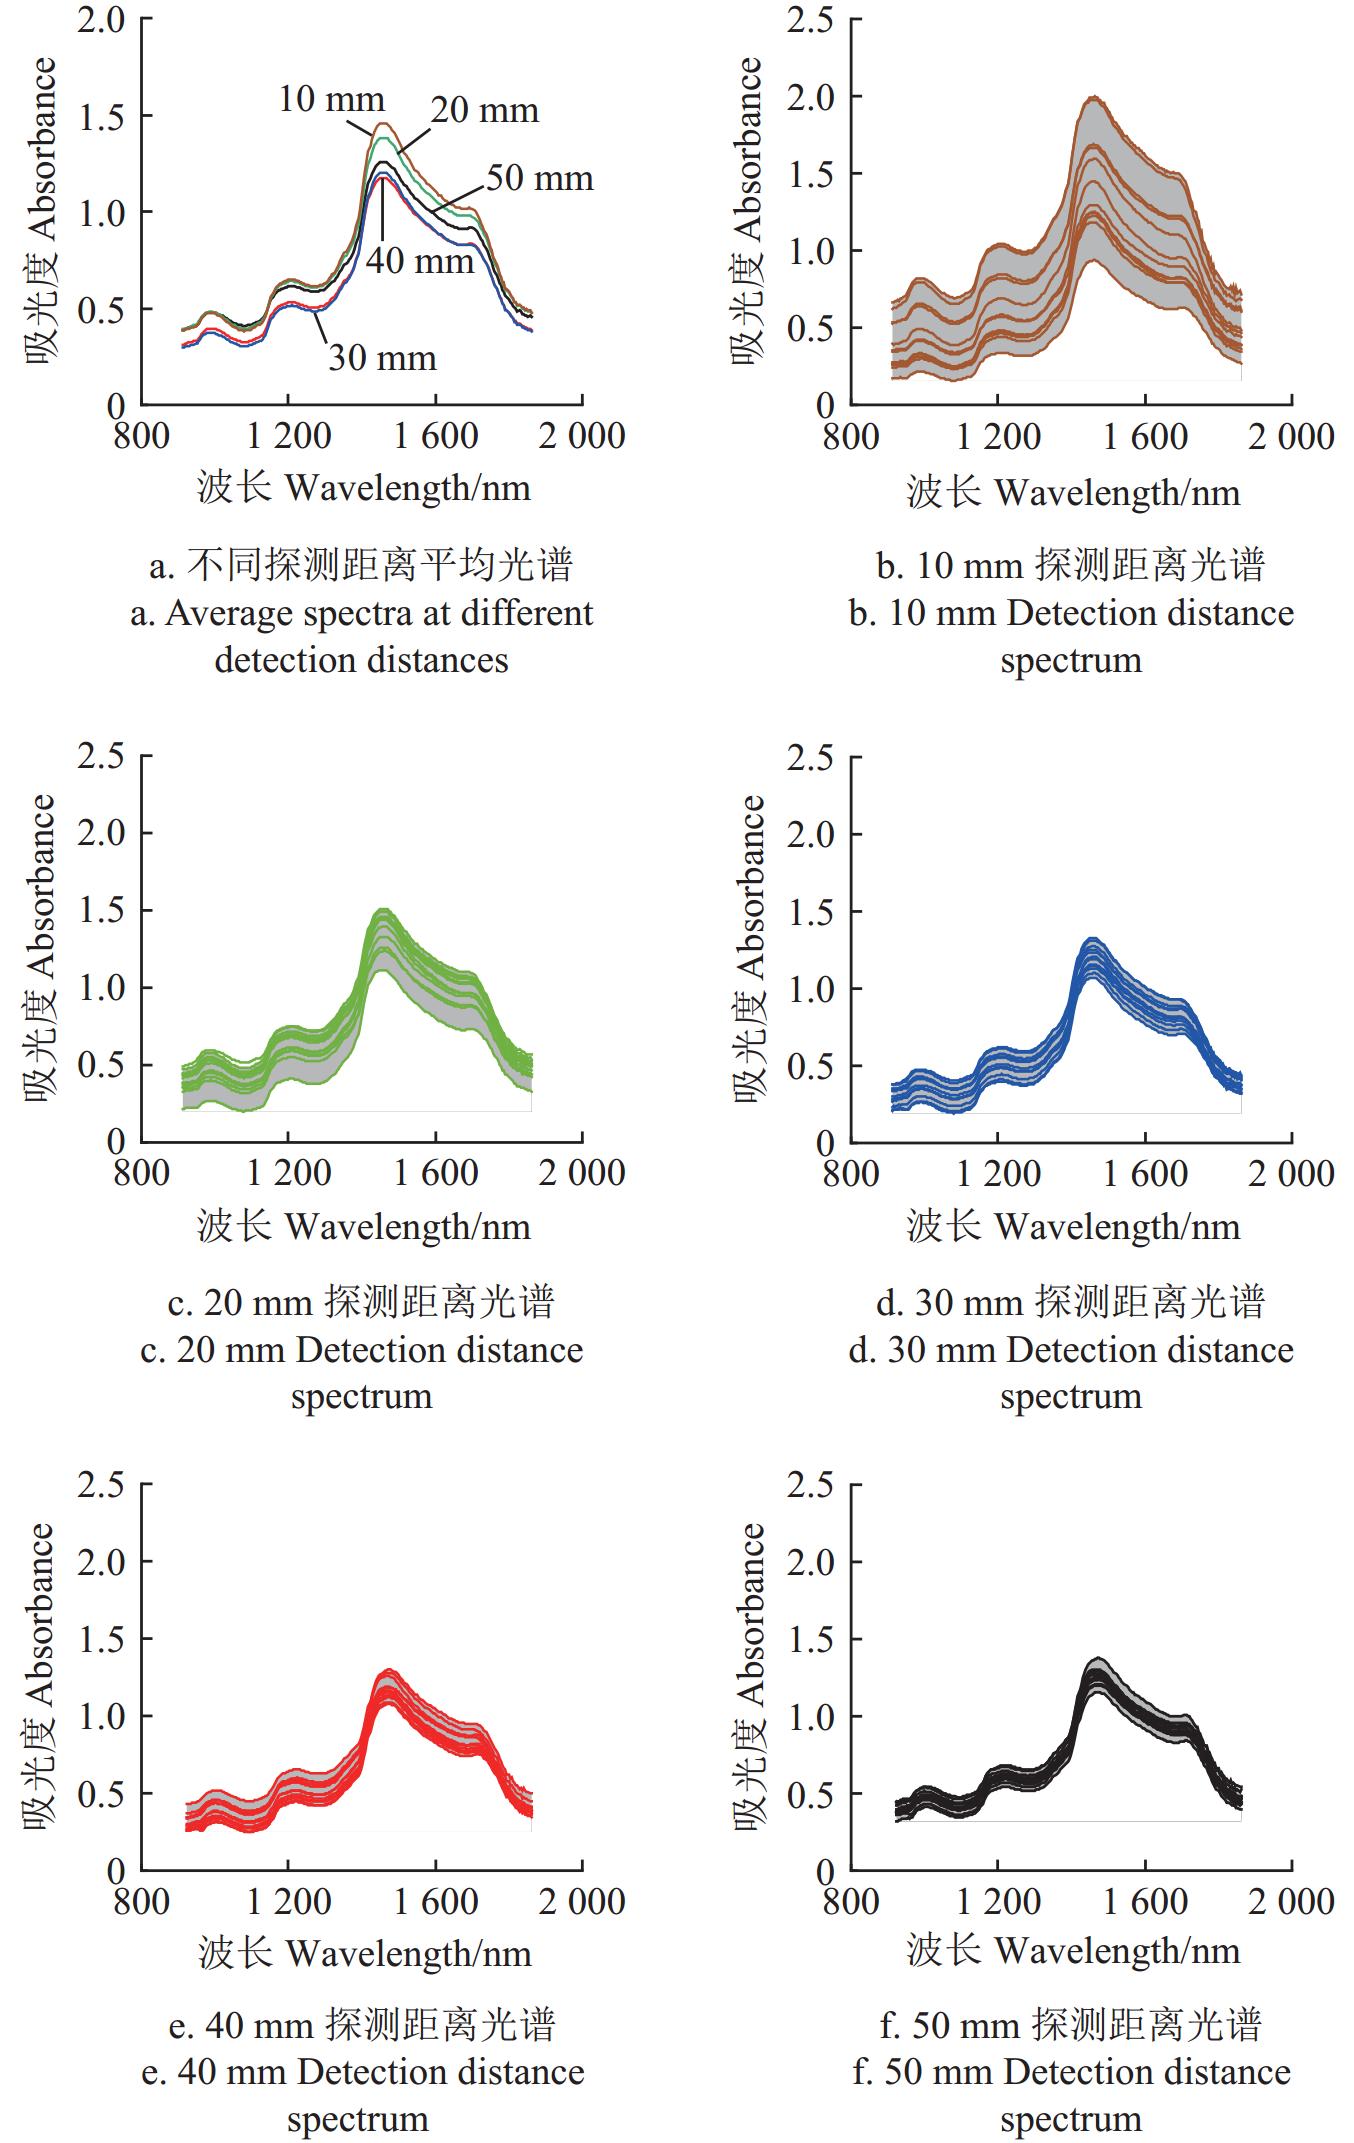
1700 nm光谱数据,进行卤素灯杯与光纤光源、卤素灯杯功率20与40 W、探测距离10 ~50 mm和30°、45°及60°卤素灯杯夹角的对比试验,分析光谱差异及曲线分布规律,采用标准差和光谱面积极差指标进行光谱质量评价。进一步开展建模验证试验,针对30°和45°卤素灯杯夹角下的光谱,经多元散射校正(multiplicative scatter correction,MSC)、标准正态变量校正(standard normal variate,SNV)、一阶导数(first derivative ,FD)和趋势校正(detrending ,DT)预处理后,应用偏最小二乘回归(partial least squares,PLS)和支持向量机(support vector machines SVM)方法建立了含水率预测模型,并对建模性能进行了对比。试验结果表明,卤素灯杯、功率20 W、探测距离40 mm对应所选果穗的光谱响应充分、干扰少,与果穗特征相匹配,曲线采用标准差和光谱面积极差分别为0.83和187.2,综合光谱曲线质量评价和建模性能对比,卤素灯杯夹角45°优于30°。通过SNV预处理后的SVM预测模型具有更好的性能,校正集和预测集决定系数分别为0.943、0.880,均方根误差分别为0.708、0.932,剩余预测偏差为2.956。该研究结果可为基于近红外漫反射光谱技术的鲜食玉米果穗内在品质无损检测提供技术支撑。Abstract:This study aims to obtain the high-quality near-infrared (NIR) spectra of fresh corn cobs. A systematic investigation was made to explore the effects of experimental parameters on the spectral features of fresh corn cobs and modeling validation using NIR diffuse reflectance spectroscopy. According to the cob stick-shaped characteristics, the multi-dimensional comprehensive test was carried out to collect 900~1700 nm spectral data under four parameters, namely, light source type, light intensity, detection distance, and light source angle. The halogen lamp cups were used as the fiber optic light sources. Among them, the halogen lamp cups were selected with the power of 20 and 40 W, detection distances of 10 and 50 mm, and halogen lamp cups with angles of 30°, 45°, and 60°, in order to analyze the spectral differences and distribution patterns of curves. The spectral differences were determined for the distribution patterns. The standard deviation and spectral area extreme deviation indexes were used to evaluate the spectral quality. Further validation tests were carried out on the model. The spectra were evaluated at 30° and 45° halogen lamp cup angles by multiplicative scatter correction (MSC), standard normal variate (SNV), first derivative (FD), and trend correction. Furthermore, the new model was established to predict the water content using partial least squares (PLS) and support vector machines (SVM). The performance of the model was compared after the derivative (FD) and detrending (DT) pre-processing. The experimental results showed that sufficient spectral response and less interference were achieved in the halogen lamp cup with a power of 20 W and a detection distance of 40 mm. The standard deviation and spectral area polarity of the curve were 0.83 and 187.2, respectively. The better quality of the spectral curve and higher performance of the model were also obtained in the halogen lamp cup with the clamp angle of 45°, compared with 30°. The better performance was found in the SVM prediction model after SNV preprocessing. The coefficients of determination were 0.943 and 0.880, respectively, in the correction and prediction datasets, while the root mean square errors were 0.708 and 0.932, respectively, and the residual prediction deviation was 2.956. The finding can provide technical support to the nondestructive test on the intrinsic quality of fresh corn cobs using near-infrared diffuse reflectance spectroscopy.
-
0. 引 言
黑色素是由吲哚类或酚类物质经过氧化聚合形成的一类高分子化合物[1],在自然界中广泛存在[2],具有抑菌[3]、调节血脂[4]、清除自由基[5]等多种生物活性。因此,黑色素作为重要的色素来源和生物活性物质,可被广泛应用于化妆品、保健品和食品领域等多种方面。
食用菌是天然黑色素的来源之一[6],梯棱羊肚菌(Morchella importuna)属于子囊菌门,主要集中在欧洲、亚洲和美洲[7],是一种珍贵的食药兼用菌,因其外观形似羊肚而出名[8]。其中梯棱羊肚菌的主要活性成分之一是黑色素,具有抗辐射、调节免疫力[9]等多种功效,对人体健康有着重要的意义。而如何快速提高梯棱羊肚菌黑色素的提取率就显得尤为重要,过去人们常常采用碱溶酸沉的方法提取黑色素[10],张艳荣等[11]采用超声波辅助的方法提取黑色素,发现其黑色素提取率普遍较低。纤维素酶是由多种酶类共同作用而成的多酶体系,能有效破坏微生物细胞壁,大大提高活性物质的提取效率,其已在诸多活性物质提取中广泛实践[12]。但将纤维素酶应用于梯棱羊肚菌黑色素提取未见报道。由于梯棱羊肚菌黑色素和黑木耳黑色素性质十分相似[13],只溶于碱性溶液,不与水和其它有机溶剂相溶。近年来通过改性的方法以增强黑色素水溶性已成为研究热点,SONG[14]等发现用D-氨基葡萄糖修饰后的粒毛盘菌YM226黑色素在水溶性和生物活性方面比未修饰的粒毛盘菌YM226黑色素有明显提高。
因此,本文探究了纤维素酶-超声波协同提取梯棱羊肚菌黑色素(Morchella importuna melanin, MIM)的提取工艺。并进一步选用赖氨酸进行修饰,得到赖氨酸-梯棱羊肚菌黑色素(lysine-modified Morchella importuna melanin, L-MIM),最后对两者进行结构表征、理化特性及稳定性分析,从而为MIM的高效提取及其产品的开发利用方面提供理论基础。
1. 材料与方法
1.1 材料与试剂
材料:梯棱羊肚菌子实体,购自山西农业大学食用菌中心。
试剂:纤维素酶、氯仿、乙酸乙酯、氯化氢,上海源叶生物科技有限公司;正丁醇,济南远祥化工有限公司;氢氧化钠,上海广涯化工有限公司。
1.2 仪器与设备
Multifuge X1R高速冷冻台式离心机,深圳瑞沃德生命科技有限公司;电子磅秤,厦门维樱仪器有限公司;BPH-7100 pH计,大连贝尔分析仪器有限公司;CWFM-10 L超微振动磨打粉机,广州市大祥电子机械设备有限公司;DF205电热鼓风干燥箱,无锡玛瑞特科技有限公司;RC-HH-2双孔数显恒温水浴锅,睿城永创公司;KQ5200DE数控超声波清洗器,深圳固特超声波有限公司;BCD-215KHM-20 ℃冰箱,北京福意电器有限公司。
1.3 方 法
1.3.1 梯棱羊肚菌黑色素的提取及优化
参考侯若琳等[15]的方法,并稍作修改。将梯棱羊肚菌子实体粉末充分溶解于蒸馏水中,添加适量纤维素酶进行超声处理,再加入NaOH溶液,12 000 r/min离心5 min,收集上清液,用HCl调溶液pH值至1~2,水浴10 h,沉淀经蒸馏水洗至pH=7.0时烘干后得MIM粗品。随后将MIM粗品重新溶于NaOH溶液中,用氯仿、乙酸乙酯除掉多余杂质,用HCl调溶液pH值至1~2,80 ℃条件下水浴2 h,沉淀经蒸馏水洗至pH=7.0时烘干,即得到纯品MIM,提取率计算式为
提取率=M1/M2×100% (1) 式中M1为MIM纯品质量,g;M2为梯棱羊肚菌子实体粉末质量,g。为了确保试验的准确性,所有试验均重复3次,取平均值。
1.3.2 单因素试验
分别设定NaOH浓度(0.5、1.0、1.5、2.0、2.5 mol/L)、纤维素酶添加量(8、12、16、20、24 mg/g)、纤维素酶酶解时间(60、80、100、120、140 min)、纤维素酶酶解温度(30、35、40、45、50 ℃)、料液比(1:10、1:20、1:30、1:40、1:50)、超声时间(40、60、80、100、120 min)进行单因素试验,计算MIM提取率。
1.3.3 Plackett-Burman 试验设计
将提取率作为判断标准,采用Plackett-Burman试验设计方法,对多种影响因素进行研究。表1中的条件变量是基于单因素试验选择的,并尽可能地覆盖了可能影响试验结果的因素,NaOH浓度、纤维素酶添加量、纤维素酶酶解时间、纤维素酶酶解温度、料液比、超声时间,分别用A、B、C、D、E、F表示。
表 1 Plackett-Burman试验设计的因素水平表Table 1. Factors and levels of Plackett-Burman experimental design因素
Factors水平Level −1 1 A/(mol·L-1) 1.0 2.0 B/(mg·g-1) 16 24 C/min 60 100 D/℃ 35 45 E 1:20 1:40 F/min 60 100 注:A表示NaOH浓度,B表示纤维素酶添加量,C表示纤维素酶酶解时间,D表示纤维素酶酶解温度,E表示料液比,F表示超声时间,下同。 Note: A represents NaOH concentration, B represents cellulase addition, C represents cellulase digestion time, D represents cellulase digestion temperature, E represents solid liquid ratio, F represents ultrasound time, the same below. 1.3.4 Box-Behnken试验设计
通过Plackett-Burman试验确定出影响梯棱羊肚菌黑色素提取率的关键因素,分别是NaOH浓度、纤维素酶添加量、纤维素酶酶解时间,如表2所示,采用Box-Behnken响应曲面法进行三因素三水平试验分析。
表 2 Box-Benhnken试验设计Table 2. Box-Benhnken experimental design因素
Factors水平Level −1 0 1 A/(mol·L-1) 1.0 1.5 2.0 B/(mg·g-1) 16 20 24 C/min 60 80 100 1.3.5 确定梯棱羊肚菌黑色素氨基酸修饰种类及质量比
参照YE等[16]的方法,并稍作修改,选择4种氨基酸,分别是精氨酸、赖氨酸、天冬氨酸、组氨酸,将4种氨基酸各称取0.01 g溶于2 mL蒸馏水中,配制成5 g/L的溶液。依次加入0.02 g MIM样品,40 ℃下震荡40 min,反应结束后冷却至室温,12 000 r/min离心2 min,上清液于500 nm波长下检测溶液吸光度。吸光度越高,溶解越完全,氨基酸修饰效果越好。
氨基酸修饰种类确定后,需进一步确定氨基酸的最适添加量。通过改变氨基酸与MIM的质量比,依次加入不同质量的氨基酸,将其混匀后,12 000 r/min离心2 min,于500 nm波长下检测溶液吸光度,以溶液的最大吸光度确定为氨基酸的最适添加量。
1.3.6 梯棱羊肚菌黑色素修饰前后的结构表征
参照王雪青等[17]的方法,并稍作修改,将MIM和L-MIM分别溶解于1.5 mol/L NaOH溶液中,将上清液在200~900 nm的紫外-可见光区进行全波长扫描使用红外光谱仪在波长4000~500 cm−1范围内进行光谱扫描[18-19],将MIM和L-MIM放置于喷金台上进行真空喷金镀膜90 s,对二者进行结构检测。
1.3.7 梯棱羊肚菌黑色素修饰前后的理化性质分析
1)梯棱羊肚菌黑色素修饰前后色价值的测定
参照WANG等[20]的方法,对MIM和L-MIM进行色价值的测定,称取0.01 g MIM和L-MIM样品分别溶解于pH=8.0的柠檬酸磷酸氢二钠缓冲溶液中,水浴1 h,12 000 r/min离心2 min,稀释上清液,在其MIM和L-MIM的最大吸收波长处测定吸光度。色价值计算式为
色价值(E1%1cm)=A⋅r/e (2) 式中A为吸光度;r为测定吸光度时所吸取MIM和L-MIM的稀释倍数;e为MIM和L-MIM的样品质量,g。
2)修饰前后梯棱羊肚菌黑色素溶解度的测定
参照罗星等[21]的方法,并稍做作修改。称取一定量的MIM和L-MIM,分别溶解于2 mL的蒸馏水中,充分混匀后,12 000 r/min离心5 min,经真空冷冻干燥后即得粉末,称质量并记录,溶解度计算式为
溶解度(g/L)=(m1−m2)/v0 (3) 式中m1为烘干后样品质量,g;m2为烘干前样品质量,g;v0为溶剂体积,L。
3)修饰前后梯棱羊肚菌黑色素水溶性的测定
称取一定量的MIM和L-MIM,分别溶解于1 mol/L NaOH溶液、1 mol/L HCl、蒸馏水、无水乙醇、75%乙醇及其他有机溶剂中,12 000 r/min离心2 min,记录颜色变化趋势及溶解情况[6]。
4)梯棱羊肚菌黑色素修饰前后在温度、光照、pH、金属离子方面稳定性的影响
参考XIAO等[22-23]的方法进行温度、光照、pH对MIM和L-MIM稳定性的影响,配制pH=8.0,1 g/L的MIM和L-MIM溶液至100 mL容量瓶中,分别于浓度为0.01%的Fe3+、Fe2+、Cu2+、Ca2+、Mg2+和Zn2+的溶液(g/mL)定容并混匀。静置2和4 h后,在MIM和L-MIM最大吸收波长下记录溶液吸光度。
1.3.8 统计学处理
应用统计软件IBM SPSS Statistics13.0分析数据。
2. 结果与分析
2.1 单因素试验
由图1a可知,随着NaOH浓度的升高,梯棱羊肚菌黑色素提取率呈先上升后下降的趋势。当NaOH浓度为1.5 mol/L时,MIM提取率最高。由此可见在一定的范围内,提高NaOH浓度有利于黑色素的提取。但浓度过高时可能会提取出脂类、蛋白质等其他物质,这些物质与黑色素发生反应导致提取率下降[24]。因此,将MIM的最适NaOH浓度定为1.5 mol/L。由图1b可知,当纤维素酶添加量为20 mg/g时,MIM提取率最高,此时酶浓度逐渐饱和。若再提高加酶量,则不利于细胞壁的降解,造成提取率下降。因此,将MIM的最适纤维素酶添加量定为20 mg/g。由图1c可知,当酶解时间为80 min时,MIM提取率达到最高,随着酶解时间的增加,此时纤维素酶活力减弱,MIM提取率逐渐趋于平缓。因此,将MIM的最适纤维素酶酶解时间定为80 min。由图1d可知,当酶解温度达到40 ℃时,MIM提取率最大,这是因为伴随提取温度的升高,活化分子百分数增加,继而加快有效碰撞次数,提高酶解效率[25]。因此,将MIM的最适酶解温度定为40 ℃。由图1e可知,当料液比为1:30时,MIM提取率最大。可能是因为增加提取溶剂使用量,MIM可以溶解完全,达到饱和状态。若料液比不当会产生过多杂质,这些杂质会与MIM发生反应。因此,将MIM的最适料液比定为1:30。由图1f可知,当超声时间为80 min时,MIM提取率最高,适当的超声时间能够充分破碎细胞壁[26],增大碱溶液与MIM接触面积,有利于MIM完全溶解于碱溶液中。若超声时间过长,会破坏MIM的稳定性,造成提取率降低。因此,将MIM的最适超声时间定为80 min。
![]() 图 1 提取条件对梯棱羊肚菌黑色素提取率的影响注:不同字母表示不同提取条件存在显著性差异(P<0.05),下同。Figure 1. Effects of extraction conditions in extraction rate of Morchella importuna melanin.Note: Different letters represent significant differences in different extraction conditions (P<0.05), the same below.
图 1 提取条件对梯棱羊肚菌黑色素提取率的影响注:不同字母表示不同提取条件存在显著性差异(P<0.05),下同。Figure 1. Effects of extraction conditions in extraction rate of Morchella importuna melanin.Note: Different letters represent significant differences in different extraction conditions (P<0.05), the same below.2.2 Plackett-Burman试验
以提取率为标准设计Plackett-Burman试验,结果如表3所示。试验结果方差分析如表4所示。
表 3 Plackett-Burman 试验结果Table 3. Plackett-Burman experiment results序号
No.A B C D E F 提取率
Extraction rate/%1 2 16 100 45 1:40 100 4.84 2 1 24 60 45 1:40 100 3.36 3 2 24 100 35 1:20 100 6.55 4 1 16 100 45 1:40 60 4.10 5 1 24 60 45 1:20 100 3.98 6 1 16 100 35 1:20 100 4.17 7 2 16 60 45 1:20 60 3.84 8 2 16 60 35 1:40 100 4.33 9 2 24 60 35 1:40 60 5.43 10 1 24 100 35 1:40 60 5.18 11 2 24 100 45 1:20 60 6.32 12 1 16 60 35 1:20 60 3.15 表 4 试验因子的显著性分析Table 4. Significance analysis of variables因素
FactorsF值
F valueP值
P value显著性
SignificanceA 78.17 0.0003 ** B 58.77 0.0006 ** C 71.94 0.0004 ** D 8.08 0.0361 * E 0.85 0.3980 - F 0.90 0.3868 - 注:**表示P<0.01,差异极显著;*表示P<0.05,差异显著;−表示P>0.05,差异不显著。 Note:** represents P<0.01, the difference was extremely significant; * represents P<0.05, the difference was significant; − represents P>0.05, the difference was not significant. 通过表3和表4可以得出,A、B、C三个因素显著性均极其显著(P<0.01)。其大小顺序为A、C、B。因此,可将以上3个因素列为重点考察因素,其他三因素条件不变。
2.3 Box-Benhnken响应面试验结果与分析
在Plackett-Burman试验的基础上,将自变量设定为:NaOH浓度、纤维素酶添加量、纤维素酶酶解时间,MIM提取率作为响应值,设计3因素3水平响应面试验,试验设计及结果见表5,方差分析结果如表6所示。
表 5 Box-Benhnken 响应面试验设计及结果Table 5. Design and results of Box-Benhnken response surface experiment序号
No.A B C 提取率
Extraction rate/%1 1.0 20 100 6.126 2 1.5 20 80 9.632 3 1.0 24 80 6.576 4 1.5 20 80 9.768 5 1.5 24 100 6.607 6 1.5 16 100 6.322 7 1.5 20 80 10.098 8 2.0 20 60 6.647 9 1.0 20 60 6.368 10 1.5 24 60 7.246 11 1.5 20 80 10.152 12 1.0 16 80 6.652 13 1.5 20 80 9.728 14 2.0 20 100 6.674 15 2.0 24 80 7.564 16 1.5 16 60 7.486 17 2.0 16 80 6.906 通过Design-expert 8.0.6软件分析得出A、B、C三个因素与Y之间的回归方程为:Y=-58.02 415+18.61 985A+2.86 272B+0.63 071C+0.09 175AB+0.00 673AC+0.00 164BC-6.82 520A2-0.07 780B2-0.00 429C2。基于回归方程进行方差分析,发现P<0.0001,即该模型具有极显著性。R2=0.9 839,该模型拟合度极好,由此可准确表述各影响因素与MIM提取率之间的关系。失拟项F=2.27不显著(P>0.05),表示该回归方程贴合实际情况。对一次项系数的绝对值分析得出,A、B、C三个因素对MIM提取率的影响因素按大小依次A、C、 B。
根据分析结果绘制响应曲面,如图2所示。由图2可知,响应曲面的倾斜度越高,即坡度越陡,两因素的交互作用越明显。
![]() 图 2 各因素交互作用对梯棱羊肚菌黑色素提取率的响应面图Figure 2. Response surface plots of interaction of various factors on Morchella importuna melanin extraction rate表 6 梯棱羊肚菌黑色素提取率方差分析表Table 6. ANOVA of Morchella importuna melanin extraction rate
图 2 各因素交互作用对梯棱羊肚菌黑色素提取率的响应面图Figure 2. Response surface plots of interaction of various factors on Morchella importuna melanin extraction rate表 6 梯棱羊肚菌黑色素提取率方差分析表Table 6. ANOVA of Morchella importuna melanin extraction rateR2=0.9 839 方差来源
Source of variance平方和
Sum of squares自由度
Degree of freedom(df)均方
Mean squareF值
F valueP值
P value模型 Model 36.06 9 4.01 47.42 <0.0001 A 0.54 1 0.54 6.33 0.0400 B 0.05 1 0.05 0.58 0.4706 C 0.51 1 0.51 6.03 0.0438 AB 0.13 1 0.13 1.59 0.2471 AC 0.02 1 0.02 0.21 0.6576 BC 0.07 1 0.07 0.82 0.3965 A2 12.26 1 12.26 145.11 <0.0001 B2 6.52 1 6.52 77.23 0.0002 C2 12.39 1 12.39 146.69 <0.0001 残差Residual 0.59 7 0.08 失拟值Lack of fit 0.37 3 0.12 2.27 0.2220 净误差Pure error 0.22 4 0.06 总离差Cor total 36.65 16 2.4 验证试验
通过该模型得出预测MIM最优提取条件为NaOH浓度1.54 mol/L、纤维素酶添加量20.14 mg/g、纤维素酶酶解时间78.6 min,在最优提取条件下,预测MIM提取率为9.89568%。
为确保验证模型预测的准确性,对预测参数做进一步验证,考虑试验的可行性,将提取MIM的纤维素酶添加量调整为20 mg/g,NaOH溶液浓度为1.54 mol/L,酶解时间为78.6 min,MIM的提取率为10.003 00%,预测值为9.895 68%,相对误差在0.99%以内,说明该模型较为可靠。
2.5 梯棱羊肚菌黑色素氨基酸种类及质量比的确定
由图3a可知,经过精氨酸、赖氨酸、天冬氨酸、组氨酸修饰后MIM吸光度均有所增加,但L-MIM的吸光度最大。
![]() 图 3 修饰梯棱羊肚菌黑色素的氨基酸种类及质量比的确定Figure 3. Types of amino acid modification of Morchella importuna melanin (MIM) solution and addition amount of lysine
图 3 修饰梯棱羊肚菌黑色素的氨基酸种类及质量比的确定Figure 3. Types of amino acid modification of Morchella importuna melanin (MIM) solution and addition amount of lysine因此,将MIM的最佳修饰氨基酸定为赖氨酸。由图3b可知,当MIM与赖氨酸质量比为1:2时,L-MIM溶液的吸光度最大,此时MIM与赖氨酸溶解完全,即氨基酸修饰效果越好。因此,可将MIM与赖氨酸的最适质量比定为1:2。
2.6 梯棱羊肚菌黑色素修饰前后的紫外-可见光谱扫描及傅里叶红外光谱扫描
由图4a可知,MIM和L-MIM趋势大体相似,在紫外光区(10~380 nm)吸收较强,随后在可见光区(400~700 nm)吸光度逐渐减小。MIM在230 nm处显示有最大特征吸收峰,与黑木耳黑色素[27](210 nm)、灵芝黑色素[26](212 nm)的最大特征吸收峰相似。经赖氨酸修饰后,L-MIM的最大吸收峰向短波方向移动,即219 nm处显示有最大特征吸收峰。此外,MIM和L-MIM在(260 nm)和(280 nm)处无特殊吸收峰,表明样品中核酸和蛋白质等杂质含量较少[28],与项锦敏等[29]报道的趋势一致。
![]() 图 4 梯棱羊肚菌黑色素修饰前后光谱图注:MIM表示梯棱羊肚菌黑色素,L-MIM表示赖氨酸-梯棱羊肚菌黑色素,下同。Figure 4. Spectroscopy analysis of MIM and L-MIMNote: MIM represents Morchella importuna melanin, L-MIM represents lysine-modified Morchella importuna melanin, the same below.
图 4 梯棱羊肚菌黑色素修饰前后光谱图注:MIM表示梯棱羊肚菌黑色素,L-MIM表示赖氨酸-梯棱羊肚菌黑色素,下同。Figure 4. Spectroscopy analysis of MIM and L-MIMNote: MIM represents Morchella importuna melanin, L-MIM represents lysine-modified Morchella importuna melanin, the same below.由图4b可知,3 396 cm−1和3 315 cm−1吸收峰对应OH伸缩振动[30],2 900 cm−1处出现尖而窄的小峰为脂肪族的C-H基团伸缩振动[31],1 650~1 620 cm−1处归属于芳香环中C酰胺I带C-O或COO-[32]。1 382 cm−1和1 402 cm−1处N-H弯曲振动峰和C-H的伸缩振动峰,表明MIM和L-MIM都具有典型黑色素的吲哚结构[33]。在2 131 cm−1处的吸收峰是NH3+的特征吸收峰[34],推测是由于赖氨酸的NH3+引起的,表明赖氨酸修饰成功。
2.7 梯棱羊肚菌黑色素修饰前后的扫描电子显微镜图像分析
由图5a可以看出,MIM样品外观表面光滑,呈均匀的立方体晶体结构,这与刘秋鸣[35]的研究结果相似。由图5b可以看出,L-MIM样品呈大型块状、表面凸起且相互粘连在一起,这可能是因为L-MIM样品易吸潮而出现的颗粒粘连的迹象,与MIM呈现明显不同,表明赖氨酸修饰是成功的。
2.8 梯棱羊肚菌黑色素修饰前后的色价值、溶解度、水溶性的测定
评价天然色素有诸多指标,色价值是其中之一,可直接反映色素含量的多少[35]。根据式(2)计算得出MIM和L-MIM的色价值(E1% 1 cm)分别为480.24和1 771.18,L-MIM的色价值明显高于MIM。
室温下,MIM不溶于水。经赖氨酸修饰后,L-MIM的溶解度为1 016 g/L。因此,该试验说明,修饰过的L-MIM溶解度增大。
由表7可知,MIM易溶于碱性溶液,微溶于乙醇溶液,不溶于水及其它有机溶剂。修饰后的L-MIM水溶性得到明显改善,既可溶于碱性溶液又可溶于水,按其水溶性排序大致为碱性溶液、蒸馏水、乙醇。
表 7 MIM和L-MIM的水溶性Table 7. Water-solubility of MIM and L-MIM类型 type 水溶性 Water solubility MIM L-MIM 蒸馏水Distilled water - ++ NaOH(1 mol·L-1) ++ ++ HCl(1 mol·L-1) - - 无水乙醇Anhydrous ethanol + + 75 %乙醇75 % Ethanol + + 正丁醇N-Butanol - - 氯仿Chloroform - - 冰乙酸Glacial acetic acid - - 异丙醇Isopropanol - - 注:++表示完全溶解,+表示微溶,-表示不溶。 Note: ++ represents fully dissolved, + represents slightly soluble, - represents insoluble. 2.9 梯棱羊肚菌黑色素修饰前后的稳定性的影响
由图6a可知,在保温20 min条件下,MIM和L-MIM的吸光度值在20、40、60、80、100 ℃条件下波动范围较小,且在此温度(20~100 ℃)下,吸光度增长缓慢。由此可知,MIM和L-MIM均具有较高的耐热性,可能与自身结构脱羧作用有关[9]。由图6b可知,MIM和L-MIM经过自然光、紫外光、避光条件下照射24 h,可以观察到两者在自然光和避光条件下吸光度变化较小。此后随着光照时间的延长,在相同的光照时间内,MIM和L-MIM在紫外光的照射下吸光度开始下降,由此可知,MIM和L-MIM在紫外光照射下稳定性差。由图6c可知,当溶液pH值为2~5时,MIM几乎不溶解,当溶液pH值为2~7时,L-MIM的吸光度差别不大,当溶液的pH值大于8时,MIM和L-MIM的吸光度显著升高,溶液颜色逐渐加深,由此可知,MIM和L-MIM在碱性条件下吸光度逐渐升高,即MIM和L-MIM在碱性条件下越稳定,可能是因为在碱性条件下MIM以离子的形式存在[36]。由图6d可知,Fe3+对MIM和L-MIM的稳定性具有显著的影响(P<0.05),可能是因为Fe3+与特定基团结合后,稳定了MIM和L-MIM的结构,并加强增色效果[37],其余的金属离子的吸光度明显变小,说明Fe2+、Cu2+、Ca2+、Mg2+、Zn2+对MIM和L-MIM的稳定性无显著影响(P<0.05)。
![]() 图 6 不同因素对梯棱羊肚菌黑色素修饰前后稳定性的影响Figure 6. Effects of different factors on the stability of MIM and L-MIM
图 6 不同因素对梯棱羊肚菌黑色素修饰前后稳定性的影响Figure 6. Effects of different factors on the stability of MIM and L-MIM3. 结 论
本试验以梯棱羊肚菌为原材料,采用纤维素酶-超声波协同提取梯棱羊肚菌黑色素,并进一步通过赖氨酸修饰,对比修饰前后的结构、理化特性及稳定性。研究发现,NaOH浓度1.54 mol/L,纤维素酶添加量20 mg/g,酶解时间78.6 min,料液比1:30,酶解温度40 ℃,超声时间80 min条件下,MIM提取率最高为10.003 00%。试验结果表明,L-MIM比MIM在水溶性、色价值方面均有所增加。此外二者在不同的温度、光照、碱性条件下均比较稳定,在使用的金属离子中,Fe3+对MIM和L-MIM的稳定性具有最显著的影响(P<0.05)。以上结果为MIM的深加工提供了一定的理论依据。
由于MIM不溶于水、色价值较低,限制了其在食品和化妆品行业的应用。通过赖氨酸修饰后发现L-MIM的色价值、溶解度高于MIM,这将很大程度上促进改性黑色素在食品和化妆品行业的应用。后续可进一步探究修饰前后梯棱羊肚菌黑色素的体外抗氧化活性,并对其抗氧化机理进行深度研究。还可通过动物试验进行体内相关生物活性研究,利用其生物活性,制备成羊肚菌高级营养饮料或者通过胶囊进行填充,不仅能够提供丰富的营养成分,还可以提高其风味,更为重要的是还能保持天然色素的独特属性。
-
![]()
图 1 近红外无损检测综合试验装置
1. 暗箱 2.光纤探头 3.卤素灯杯 4.旋转滑台5.左侧二维(X-Y 轴)滑台 6.探头滑台 7.鲜食玉米果穗 8.支撑台 9.Y型光纤 10.光纤用电源 11.近红外光谱仪 12.电脑 13.卤素灯杯电源 14.线缆
Figure 1. Near infrared nondestructive testing comprehensive test device
1. Dark boxes 2. Fiber optic probe 3. Halogen lamp 4.Rotary slide 5. Left two-dimensional (X-Y axis) slide table 6. Probe slide 7.Fresh corn on the cob 8. Support platform 9. Y type optical fiber 10. Fiber optic light source 11.Near infrared spectrometer 12.Computer 13.Halogen lamp light source 14.Cable
![]()
图 2 光谱采集试验X-Y平面简图
注:r1:物料半径(mm);H:光纤探头与物料之间的距离(mm);r2:左右卤素灯杯与焦点距离(mm);O:照面面积中心点为焦点;θ:光纤探头之间的光源夹角(°)。
Figure 2. Spectral acquisition test X-Y plan sketch
Note: r1: radius of the material(mm); H: distance between the fiber optic probe and the material(mm); r2: distance between the left and right halogen lamp cups and the focal point(mm); O: the center point of the illuminated surface area as the focal point; θ: angle of the light source between the fiber optic probe(°).
![]()
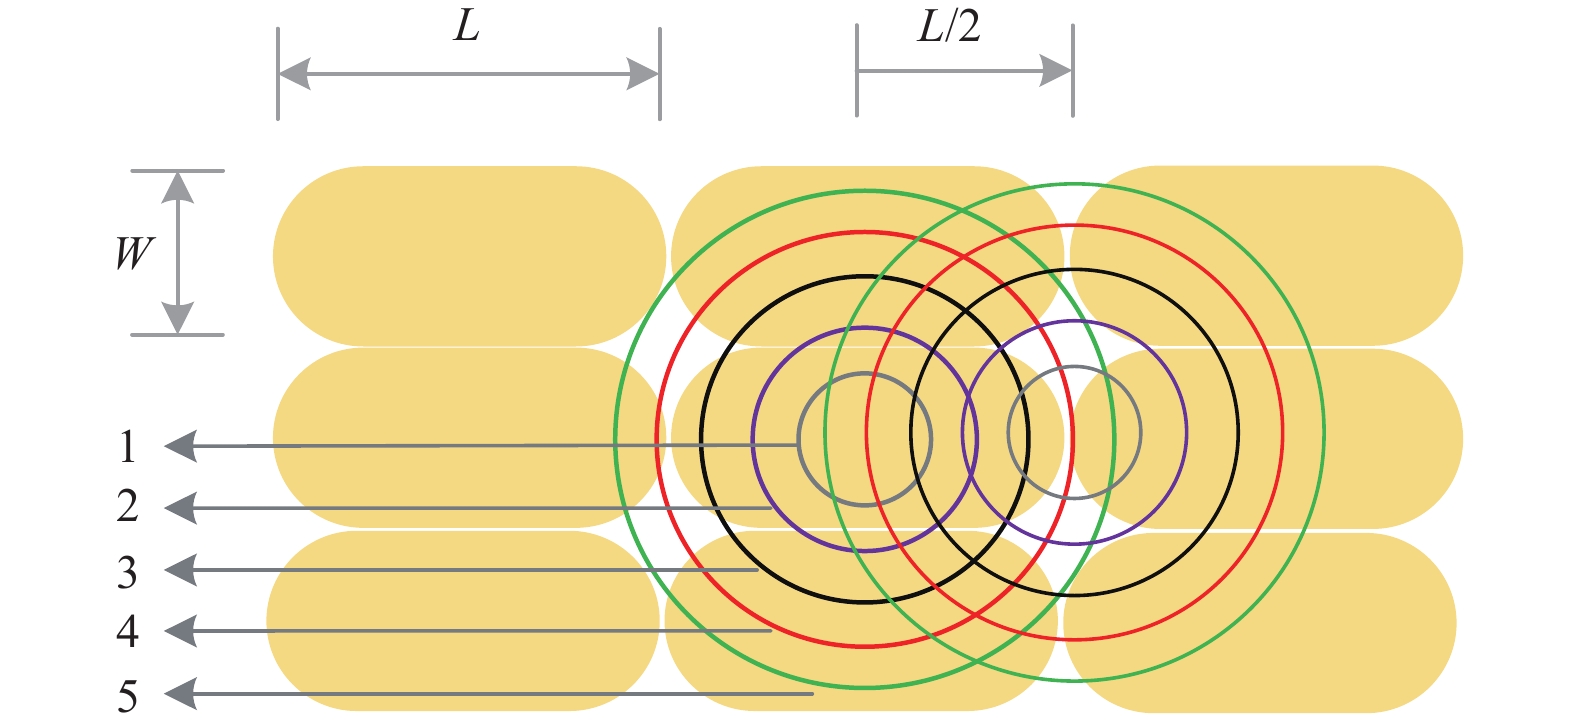
图 7 不同探测距离响应面积轮廓图
1.10 mm响应轮廓 2.20 mm响应轮廓 3.30 mm响应轮廓 4.40 mm响应轮廓 5.50 mm响应轮廓1.10 mm Response profile 2.20 mm Response profile 3.30 mm Response profile 4. 40 mm Response profile 5.50 mm Response profile
Figure 7. Response area contours for different detection distances
注:L为籽粒顶部宽度,W为籽粒厚度。Note: L is the width of the top of the seed, W is the thickness of the seed
![]()
图 9 两种光源角度下的玉米样本采集光谱
Figure 9. Spectra of corn sample collection at two clamping angles
表 1 响应面积大小与探测距离关系
Table 1 The relationship between the size of the aesponse area and the detection distance
序号NO. 探测距离
Detection distance/mm响应面积
Aesponse area size/mm21 10 1.3 2 20 2.7 3 30 4.0 4 40 5.4 5 50 6.7  下载: 导出CSV
表 2 不同探测距离光谱误差统计
Table 2 Spectral error statistics for different detection distances
序号
NO.探测距离
Detection distance/mm光谱面积极差
Spectral area extreme difference标准差
Standard deviation1 10 697.8 3.13 2 20 312.5 1.19 3 30 199.0 0.90 4 40 187.2 0.83 5 50 145.7 0.54
下载: 导出CSV
表 3 不同光源角度光谱误差统计
Table 3 Spectral error statistics for different light source angles
序号
NO.光源角度
Angle of light source
/(°)光谱面积极差
Spectral area extreme
difference标准差
Standard deviation1 30 149.2 0.57 2 45 187.2 0.83 3 60 291.4 1.24
下载: 导出CSV
表 4 30°不同处理方法的鲜食玉米含水率建模检测结果
Table 4 Results of water content modeling test of fresh corn at 30° for different treatments
序号
NO.模型
Model预处理
Pre-processing校正集 Calibration set 预测集 Prediction set R2C RMSEC R2P RMSEP RPD 1 PLS None 0.898 0.959 0.845 0.970 2.603 2 PLS MSC 0.910 0.890 0.843 0.917 2587 3 PLS SNV 0.914 0.870 0.830 0.953 2.490 4 PLS FD 0.928 0.838 0.756 0.999 2.077 5 PLS DT 0.929 0.807 0.834 1.013 2.520 6 SVM None 0.894 0.980 0.854 0.941 2.685 7 SVM MSC 0.911 0.887 0.846 0.907 2.614 8 SVM SNV 0.945 0.697 0.845 0.910 2.608 9 SVM FD 0.807 1.125 0.687 1.132 1.833 10 SVM DT 0.918 0.867 0.824 1.044 2.444
下载: 导出CSV
表 5 45°不同处理方法的鲜食玉米含水率建模检测结果
Table 5 Results of water content modeling test for fresh corn with different treatments at 45°
序号
NO.模型
Model预处理方法
Pre-processing校正集 Calibration set 预测集 Prediction set R2C RMSEC R2P RMSEP RPD 1 PLS None 0.907 0.903 0.863 0.985 2.767 2 PLS MSC 0.901 0.933 0.849 1.044 2.639 3 PLS SNV 0.902 0.928 0.851 1.035 2.661 4 PLS FD 0.942 0.712 0.874 0.980 2.886 5 PLS DT 0.910 0.843 0.881 1.103 2.969 6 SVM None 0.915 0.865 0.882 0.911 2.992 7 SVM MSC 0.895 0.960 0.858 1.012 2.722 8 SVM SNV 0.943 0.708 0.880 0.932 2.956 9 SVM FD 0.775 1.400 0.865 1.013 2.792 10 SVM DT 0.896 0.905 0.891 1.051 3.115 注:PLS:偏最小二乘; SVM:支持向量机; None:无预处理;MSC:多元散射校正; SNV: 标准正态变量校正; FD:一阶导数; DT:趋势校正;R2C:校正集决定系数;R2P:预测集决定系数;RMSEC:校正集均方根误差;RMSEP:预测集均方误差;RPD:剩余预测偏差。 Note: PLS: partial least squares ; SVM: support vector machine; None: no preprocessing; MSC: multiple scattering correction; SNV: standard normal variable; FD: first derivative; DT:detrending; R2C: coefficient of determination for calibration set ; R2P: coefficient of determination for prediction set; RMSEC: root mean square error of the calibration set; RMSEP: root mean square error of the prediction set; RPD: residual prediction deviation.
下载: 导出CSV
-
[1] 安林,程乙,罗上轲,等. 鲜食糯玉米营养品质及其影响因素研究进展[J]. 山地农业生物学报,2023,42(5):40-45. AN Lin, CHENG Yi, LUO Shangke, et al. Progress of research on nutritional quality of fresh glutinous corn and its influencing factors[J]. Journal of Mountain Agricultural Biology, 2023, 42(5): 40-45. (in Chinese with English abstract)
[2] 徐丽,赵久然,卢柏山,等. 我国鲜食玉米种业现状及发展趋势[J]. 中国种业,2020(10):14-18. doi: 10.3969/j.issn.1671-895X.2020.10.005 XU Li, ZHAO Jiuran, LU Baishan, et al. Current situation and development trend of fresh corn seed industry in China[J]. China Seed Industry, 2020(10): 14-18. (in Chinese with English abstract) doi: 10.3969/j.issn.1671-895X.2020.10.005
[3] 李紫琪,古艳婷,郭燕枝,等. 我国鲜食玉米标准体系及营养标准研究[J]. 食品安全质量检测学报,2022,13(18):5964-5973. doi: 10.3969/j.issn.2095-0381.2022.18.spaqzljcjs202218024 LI Ziqi, GU Yanting, GUO Yanzhi, et al. Research on the standard system and nutritional standard of fresh corn in China[J]. Journal of Food Safety and Quality Inspection, 2022, 13(18): 5964-5973. (in Chinese with English abstract) doi: 10.3969/j.issn.2095-0381.2022.18.spaqzljcjs202218024
[4] LI Z, HONG T, ZHAO Z, et al. Fatty acid profiles and nutritional evaluation of fresh sweet-waxy corn from three regions of China[J]. Foods, 2022, 11(17): 2636. doi: 10.3390/foods11172636
[5] CORTES V, Blasco J, Aleixos N, et al. Monitoring strategies for quality control of agricultural products using visible and near-infrared spectroscopy: A review[J]. Trends in Food Science & Technology, 2019, 85: 138-148.
[6] YE W, XU W, YAN T, et al. Application of near-infrared spectroscopy and hyperspectral imaging combined with machine learning algorithms for quality inspection of grape: A review[J]. Foods, 2023, 12(1): 132. doi: 10.3390/foods12010132
[7] MUNAWAR A , ZULFARIZAL Z, HAYATI R. Agricultural products quality determination by means of near infrared spectroscopy[C]//IOP Conference Series: Earth and Environmental Science, International Conference on Agriculture and Bio-industry (ICAGRI 2021) ,2022, 951(1): 012112.
[8] COSTA E V S, ROCHA M F V, HEIN P R G, et al. Influence of spectral acquisition technique and wood anisotropy on the statistics of predictive near infrared–based models for wood density[J]. Journal of Near Infrared Spectroscopy, 2018, 26(2): 106-116. doi: 10.1177/0967033518757070
[9] 张小斌,朱怡航,赵懿滢,等. 基于可见/近红外光谱的水蜜桃糖度无损检测方法优化研究[J]. 浙江农业学报,2023,35(7):1617-1625. ZHANG Xiaobin, ZHU Yihang, ZHAO Yiying, et al. Optimization of non-destructive detection method of peach brix based on visible/near-infrared spectroscopy[J]. Acta Agriculturae Zhejiangensis, 2023, 35(7):1617-1625. (in Chinese with English abstract)
[10] GRASSI S, JOLAYEMI O S, Giovenzana V, et al. Near infrared spectroscopy as a green technology for the quality prediction of intact olives[J]. Foods, 2021, 10(5): 1042. doi: 10.3390/foods10051042
[11] 刘燕德,饶宇,孙旭东,等. 尺寸差异对脐橙糖度可见近红外光谱检测模型影响[J]. 光谱学与光谱分析,2020,40(10):3241-3246. LIU Yande, RAO Yu, SUN Xudong, et al. Influence of size difference on the visible near-infrared spectroscopic detection model of navel orange sugar[J]. Spectroscopy and Spectral Analysis, 2020, 40(10): 3241-3246. (in Chinese with English abstract)
[12] 刘燕德,吴明明,李轶凡,等. 苹果可溶性固形物和糖酸比可见/近红外漫反射与漫透射在线检测对比研究[J]. 光谱学与光谱分析,2017,37(8):2424-2429. LIU Yande, WU Mingming, LI Yifan,et al. Comparative study of visible/near-infrared diffuse reflectance and diffuse transmittance on-line detection of soluble solids and sugar-acid ratio in apple[J]. Spectroscopy and Spectral Analysis, 2017, 37(8): 2424-2429. (in Chinese with English abstract)
[13] XU Z, CHENG W, FAN S, et al. Data fusion of near-infrared diffuse reflectance spectra and transmittance spectra for the accurate determination of rice flour constituents[J]. Analytica Chimica Acta, 2022, 1193: 339384. doi: 10.1016/j.aca.2021.339384
[14] ZHANG Y, WANG Z, TIANX, et al. Online analysis of watercore apples by considering different speeds and orientations based on Vis/NIR full-transmittance spectroscopy[J]. Infrared Physics & Technology, 2022, 122: 104090.
[15] 孙通,李翰林,孔令飞,等. 光源光斑直径对苹果霉心病近红外检测的影响[J]. 农业工程学报,2023,39(24):298-305. SUN Tong, LI Hanlin, KONG Lingfei,et al. Effect of light source spot diameter on near-infrared detection of apple moldy heart disease[J]. Transactions of the Chinese Society of Agricultural Engineering(Transactions of the CSAE), 2023, 39(24):298-305. (in Chinese with English abstract)
[16] LIU, S Q, HUANG W Q ,LIN L,et al. Effects of orientations and regions on performance of online soluble solids content prediction models based on near-infrared spectroscopy for peaches[J]. Foods, 2022, 11.10: 1502.
[17] LI J, RAO X, WANG F, et al Automatic detection of common surface defects on oranges using combined lighting transform and image ratio methods. [J] Postharvest Biol Technol, 2013, 82: 59–69.
[18] TIAN S, HANG M, LL B, et al. Measurement orientation compensation and comparison of transmission spectroscopy for online detection of moldy apple core[J]. Infrared Physics & Technology, 2020, 111: 103510.
[19] XIAO S, HE Y. Application of near-infrared spectroscopy and multiple spectral algorithms to explore the effect of soil particle sizes on soil nitrogen detection[J]. Molecules, 2019, 24(13): 2486.
[20] 孙潇鹏,刘灿灿,陆华忠,等. 基于可见-近红外透射光谱的蜜柚检测中影响因素分析[J]. 包装与食品机械,2022,40(4):1-7. doi: 10.3969/j.issn.1005-1295.2022.04.001 SUN Xiaopeng, LIU Canchan, LU Huazhong, et al. Analysis of influencing factors in the detection of honeydew based on visible-near infrared transmission spectroscopy[J]. Packaging and Food Machinery, 2022, 40(4): 1-7. (in Chinese with English abstract) doi: 10.3969/j.issn.1005-1295.2022.04.001
[21] 韩岷杰,王相友,许英超,等. 马铃薯近红外光谱无损检测影响因素研究[J]. 光谱学与光谱分析,2023,43(1):37-42. HAN Minjie, WANG Xiangyou, XU Yingchao, et al. Study on factors affecting nondestructive testing of potato by near-infrared spectroscopy[J]. Spectroscopy and Spectral Analysis, 2023, 43(1): 37-42. (in Chinese with English abstract)
[22] XUE J J,YANG Z L ,HAN L J ,et al . Study of the influence of NIRS acquisition parameters on the spectral repeatability for on-line measurement of crop straw fuel properties[J]. Fuel,2014, 117: 1027-1033.
[23] 廉孟茹,张淑娟,任锐,等. 基于高光谱技术的鲜食水果玉米含水率无损检测[J]. 食品与机械,2021,37(9):127-132. LIAN Mengru, ZHANG Shujuan, REN Rui, et al. Non-destructive detection of water content in fresh fruit corn based on hyperspectral technology[J]. Food and Machinery, 2021, 37(9): 127-132. (in Chinese with English abstract)
[24] ZHANG Q, HUANG W, WANG Q, et al. Detection of pears with moldy core using online full-transmittance spectroscopy combined with supervised classifier comparison and variable optimization[J]. Computers and Electronics in Agriculture, 2022, 200: 107231. doi: 10.1016/j.compag.2022.107231
[25] SAWYER T W, LUTHMAN A S, BOHNDIEK S E. Evaluation of illumination system uniformity for wide-field biomedical hyperspectral imaging[J]. Journal of Optics, 2017, 19(4): 045301. doi: 10.1088/2040-8986/aa6176
[26] YAO S, ZHANG L, YIN K, et al. Identifying laser-induced plasma emission spectra of particles in a gas–solid flow based on the standard deviation of intensity across an emission line[J]. Journal of Analytical Atomic Spectrometry, 2018, 33(10): 1676-1682. doi: 10.1039/C8JA00194D
[27] LIU W, HAN Y, WANG N, et al. Apple sugar content non-destructive detection device based on near-infrared multi-characteristic wavelength[C]. Journal of Physics: Conference Series. IOP Publishing, 2022, 2221(1): 012012.
[28] 胡志威,彭润玲,秦汉,等. LightTools软件在均匀光分布的照明系统设计中的应用[J]. 光学仪器,2012, 34(4): 49-53. HU Zhiwei, PENG Runling, QIN Han, et al. Application of LightTools software in the design of lighting systems with uniform light distribution[J]. Optical Instruments, 2012, 34(4): 49-53. (in Chinese with English abstract)
[29] JIAIL Z H U, PING Z, GANG L I, et al. Stray light analysis of low-level-light optical system with LightTools software[J]. Journal of Applied Optics, 2022, 34(4): 49-53.
[30] 王雪,马铁民,杨涛,等. 基于近红外光谱的灌浆期玉米籽粒水分小样本定量分析[J]. 农业工程学报,2018,34(13):203-210. WANG Xue, MA Tiemin, YANG Tao, et al. Quantitative analysis of corn kernel moisture in small samples during filling period based on near-infrared spectroscopy[J]. Journal of Agricultural Engineering, 2018, 34(13): 203-210. (in Chinese with English abstract)
[31] 樊梦丽,赵越,刘言,等. 近红外光谱水光谱组学[J]. 化学进展,2015,27(Z1):242-250. FAN Mengli, ZHAO Yue, LIU Yan, et al. Near-infrared spectroscopy of water spectrometry[J]. Advances in Chemistry, 2015, 27(Z1): 242-250. (in Chinese with English abstract)
[32] 龚志远,李轶凡,刘燕德,等. 光源照射角度对苹果糖度近红外光谱检测的影响研究[J]. 激光与光电子学进展,2016,53(2):23004. GONG Zhiyuan, LI Yifan, LIU Yande, et al. Study on the influence of light source irradiation angle on apple sugar content near infrared spectroscopy detection[J]. Laser & Optoelectronics Progress, 2016, 53(2): 23004.
[33] ZHANG X, LI S, SHAN Y, et al. Accurate nondestructive prediction of soluble solids content in citrus by near‐infrared diffuse reflectance spectroscopy with characteristic variable selection[J]. Journal of Food Processing and Preservation, 2022, 46(4): e16480.
[34] XIAO H, LIU Y, LIU Y, et al. Diagnosis of Citrus Greening Based on the Fusion of Visible and Near-Infrared Spectra[J]. Applied Sciences, 2023, 13(18): 10082. doi: 10.3390/app131810082
[35] YU J , WANG H , SUN X , et al. Parameter optimization in soluble solid content prediction of entire bunches of grape based on near-infrared spectroscopic technique[J]. Journal of Food Measurement & Characterization, 2017, 11(6): 1-5.
[36] 冉世前,杜玉婕,赵小敏,等. 鲜食玉米品种比较试验及品质评价[J]. 耕作与栽培,2023,43(5):84-88. RAN Shizian, DU Yujie, ZHAO Xiaomin, et al. Comparative trials and quality evaluation of fresh corn varieties[J]. Tillage and Cultivation, 2023, 43(5): 84-88. (in Chinese with English abstract)
[37] 曾贤明,韩龙波,文韬,等. 近红外光谱检测柑橘糖度光照角度可调装置设计与试验[J]. 食品与机械,2023,39(8):76-83. ZHENG Xianming, HAN Longbo, WEN Tao, et al. Design and test of adjustable illumination angle device for citrus brix detection by near infrared spectroscopy[J]. Food and Machinery, 2023, 39(8): 76-83. (in Chinese with English abstract)
[38] 吕雪刚,李修华,张诗敏,等. 可见-近红外透射光谱检测活体甘蔗蔗糖分的方法[J]. 光谱学与光谱分析,2021,41(12): 3747-3752. LU Xuegang, LI Xiuhua, ZHANG Shimin, et al. A method for detecting sucrose in living sugarcane with visible-NIR transmittance spectroscopy[J]. Spectroscopy and Spectral Analysis, 2021, 41(12): 3747-3752. (in Chinese with English abstract)
-
期刊类型引用(7)
1. 雷泽鑫,罗俊杰,张文正,高静,赵旭强. LUCC多情景模拟下黄土沟壑区流域径流响应规律及其适应性规划对策——以晋西三川河流域为例. 生态学报. 2025(03): 1090-1101 .  百度学术
百度学术
2. 严增,焦菊英,唐柄哲,曹斌挺,李航,梁越,祁泓锟,廖俊,徐倩,严晰芹,李萌萌,姜晓晗,张子琦,李建军. 黄土丘陵沟壑区坡沟系统产流产沙对源-汇-路径格局的响应. 农业工程学报. 2024(05): 118-127 . 本站查看
3. 陈素娥,马瑞,张富,王玲莉,蒋承洋. 甘肃省庆城县极端暴雨下水保措施抵御暴洪灾害的能力. 水土保持通报. 2024(03): 26-35 . 百度学术
4. 王琳,褚珍雄,薛一峰,何小亮,黎静. 考虑降雨-洪水-泥沙作用下的淤地坝溃决致灾风险评估. 水力发电学报. 2024(08): 32-45 . 百度学术
5. 韦江杏,邓羽松. 花岗岩红壤丘陵区崩岗侵蚀与典型切沟侵蚀的异同点探析. 土壤. 2024(04): 718-725 . 百度学术
6. 王小云,韩佩洋. 不同年限梯田土壤团聚体组成特征及演变趋势研究. 土壤通报. 2024(06): 1574-1584 . 百度学术
7. 白晨赟,余小玲,马琛琛,韩晓阳,乔江波,朱元骏. 梯田侧壁显著影响黄土塬区梯田土壤水分空间分布. 水土保持学报. 2024(06): 105-112 . 百度学术
其他类型引用(7)


计量
- 文章访问数: 147
- HTML全文浏览量: 5
- PDF下载量: 49
- 被引次数: 14