Impact of irrigation on land-atmosphere coupling strength in main grain-producing regions of China
-
摘要:
作为粮食稳产增产的关键措施,灌溉对气候变化的影响不容忽视,研究灌溉对陆气耦合强度的影响对于深入理解灌溉在气候变化中的作用至关重要。该研究利用ERA5再分析数据集和全球灌溉面积数据集对中国粮食主产区陆气耦合强度指数(coupling strength index , CSI)进行了定量分析,结合土壤湿度和潜热通量探讨了灌溉对CSI的影响。结果表明,灌溉对中国粮食主产区CSI有明显增强效应,且近年来这种增强效应在北方和南方分别以0.99×10⁻⁴、2.53×10⁻⁴ MJ/m2的速度逐渐变大,1996年前后东亚气候发生了明显转折,导致降水和土壤湿度的变化趋势发生了转折,使得南方粮食主产区土壤湿度降低,由“辐射限制型”向“土壤湿度限制型”转换,导致灌溉对南方粮食主产区CSI的增强作用有所提高。研究揭示了灌溉对中国粮食主产区CSI的影响,为国家粮食安全和适应气候变化发展战略提供了参考。
Abstract:Irrigation was a critical measure for ensuring stable and increased grain production, and its influence on climate change was significant and could not be overlooked. Investigating the influence of irrigation on the strength of land-atmosphere coupling was essential for enhancing our knowledge of the impact of irrigation on climate change. This study leveraged the ERA5 reanalysis dataset alongside the global irrigation area dataset to perform a quantitative analysis of Coupling Strength Index (CSI) in both densely and reference irrigated areas within China's primary grain-producing regions. The analysis incorporated soil moisture and latent heat flux to explore the impact of irrigation on CSI. First, we applied the commonly used Pettitt test, Buishand test, and SNHT test in the field of agrometeorology to conduct a change-point analysis on the calculated CSI in China's main grain-producing areas. We found that CSI experienced a shift in 1996, changing from a decreasing trend before 1996 to an increasing trend afterward. Then, we explored how irrigation affected CSI by dividing the areas into intensive irrigation regions and reference irrigation regions. The results showed that large-scale irrigation expansion could have altered local climate conditions, significantly impacting CSI. Furthermore, the larger the proportion of irrigated area, the higher the CSI. The greater the difference in the proportion of irrigated area, the greater the difference in CSI. There was a significant difference in CSI values between northern and southern China. Historically, the annual CSI values in the north ranged between −
0.008 MJ/m2 and0.009 MJ/m2, while in the south, they ranged between −0.018 MJ/m2 and −0.007 MJ/m2. The annual CSI in northern China was generally stronger than in southern China, with the northern CSI values being distributed across both positive and negative ranges, whereas the southern CSI values were exclusively in the negative range. The impact of irrigation on CSI intensified with the increase in irrigation area disparity. Irrigation had a significant enhancing effect on the CSI in China's major grain-producing regions. This effect was more pronounced in northern China compared to southern China and was greater in densely irrigated areas than in reference irrigated areas. In recent years, this enhancing effect had been increasing at rates of 0.99×10⁻⁴ MJ/m2 per year in the north and 2.53×10⁻⁴ MJ/m2 per year in the south. This trend suggested that China was moving towards a more arid climate. After 1996, the trend in CSI changes for densely irrigated areas in both the north and south had become consistent. However, the trend in CSI changes for reference irrigated areas in the north was higher than in the south. This had resulted in a reduction in the CSI difference between densely and reference irrigated areas in the north, while in the south, this difference had significantly increased. A significant climatic shift occurred around 1996 in East Asia, leading to changes in precipitation and soil moisture trends. This shift caused a decrease in soil moisture in the main grain-producing regions of southern China, transitioning from a "radiation-limited" to a "soil moisture-limited" regime. Consequently, the enhancing effect of irrigation on CSI in southern China's main grain-producing regions increased. Although the overall decrease in soil moisture in China after the 1990s was an indisputable fact, there was still no clear conclusion on the relative contributions of human activities and climate shifts. This study revealed the impact of irrigation on CSI in China's main grain-producing regions, providing scientific references for national food security and climate change adaptation strategies. -
0. 引 言
近年来,极端天气事件的频发给人类社会经济和农业生产带来了巨大损失[1–2],从气候系统各圈层相互作用机制出发寻求极端天气事件研究的突破点已成为当前科学发展的新动向[3–6]。陆面与大气相互作用是极端天气事件的主要驱动因子之一[7–10],理解其影响机制对于应对极端天气和确保粮食产量稳定具有重要意义[11]。
作为衡量陆面与大气相互作用程度的指标[12],陆气耦合强度受到陆面农业灌溉和大气环流变化的共同影响[13–16]。CHOU等[17]的研究表明,灌溉对印度夏季季风降雨的影响因地区而异,可能导致陆气耦合强度的增加或减少,主要取决于正反馈和负反馈之间的竞争影响;LU等[18]通过使用包含作物生长动态和精准灌溉的区域气候模式(WRF3.3–CLM4crop)对美国大平原地区进行分析,发现灌溉降低了美国中西部和北部大平原的耦合强度,并且这种降低与灌溉农田土壤湿度的增加高度相关。从能量角度,灌溉农田的蒸发冷却作用降低了地表温度[19]。从水量平衡角度,灌溉增加了土壤湿度和蒸散量,并通过水汽输送和大气环流的变化影响降水[20];BADGER等[21]的研究同样表明灌溉降低了亚马逊地区的陆气耦合强度。
在中国区域,陆气耦合强度的空间分布特征随耦合强度指标定义的不同而发生改变,基于土壤湿度与潜热通量耦合指标的高值区主要集中在内蒙古、甘肃、青海和新疆等中国干旱半干旱地区[22],基于感热通量与地表气温耦合指标的高值区则主要分布在河套-内蒙古地区、新疆西南部地区和长江以南部分区域[23]。现有关于中国区域的研究主要集中在大气环流对陆气耦合强度的影响方面,大规模农业灌溉对陆气耦合强度的影响尚未得到充分的论述。已有研究发现[24],更强的陆气耦合可以加剧气候变化对全球玉米产量的影响。中国的灌溉耕地约占总耕地面积的50%[25],其中粮食主产区的耕地灌溉面积占全国的近70%,2022年粮食产量达到53 718万t,占全国总产量的78.2%[26],且粮食主产区随纬度变化具有复杂多样的气候背景和土壤条件,探明灌溉对中国粮食主产区陆气耦合强度的影响机制对于保障国家粮食安全至关重要。
鉴于此,本文利用再分析数据深入评估不同灌溉占比对中国粮食主产区陆气耦合强度的影响,采用TLM(two-legged metrics)指标对中国粮食主产区的陆气耦合强度年际变化趋势、受灌溉的影响以及空间分布特征进行分析,明晰近50年灌溉扩张对粮食主产区陆气耦合强度的长期影响,以期为未来农业生产应对气候变化提供参考。
1. 资料和方法
1.1 研究区域概况
中国粮食主产区包括中国北方7省、南方6省,自北向南跨越多个气候类型,以800 mm等降水量线为界,北方省份粮食主产区(辽宁、河北、山东、吉林、内蒙古、河南、黑龙江)主要位于温带季风气候带,其显著特征为四季分明、夏季高温多雨,冬季寒冷干燥,年降水量相对较低;南方省份粮食主产区(江西、湖南、四川、湖北、江苏、安徽)处于亚热带季风气候区,夏季高温多雨、冬季温和少雨。
1.2 数据与方法
1.2.1 气象数据
土壤湿度和地表潜热通量数据来源于欧洲中期天气预报中心(ECMWF)的ERA5-Land数据集(https://cds.climate.copernicus.eu/datasets/reanalysis-era5-land?tab=overview),已有学者利用原位观测数据对ERA5-Land数据集中土壤湿度与潜热通量的精度进行了评估和验证[27-28],结果表明其适用于中国区域的长时间序列分析研究。该数据集的空间分辨率为0.1°×0.1°,满足以中国粮食主产区为研究区域的尺度需要,时间分辨率为小时数据,选取的时间段为1970—2015年。
1.2.2 灌溉面积数据
灌溉面积数据(area equipped for irrigation, AEI)来源于MEHTA等[29]构建的历史数据集(https://zenodo.org/records/
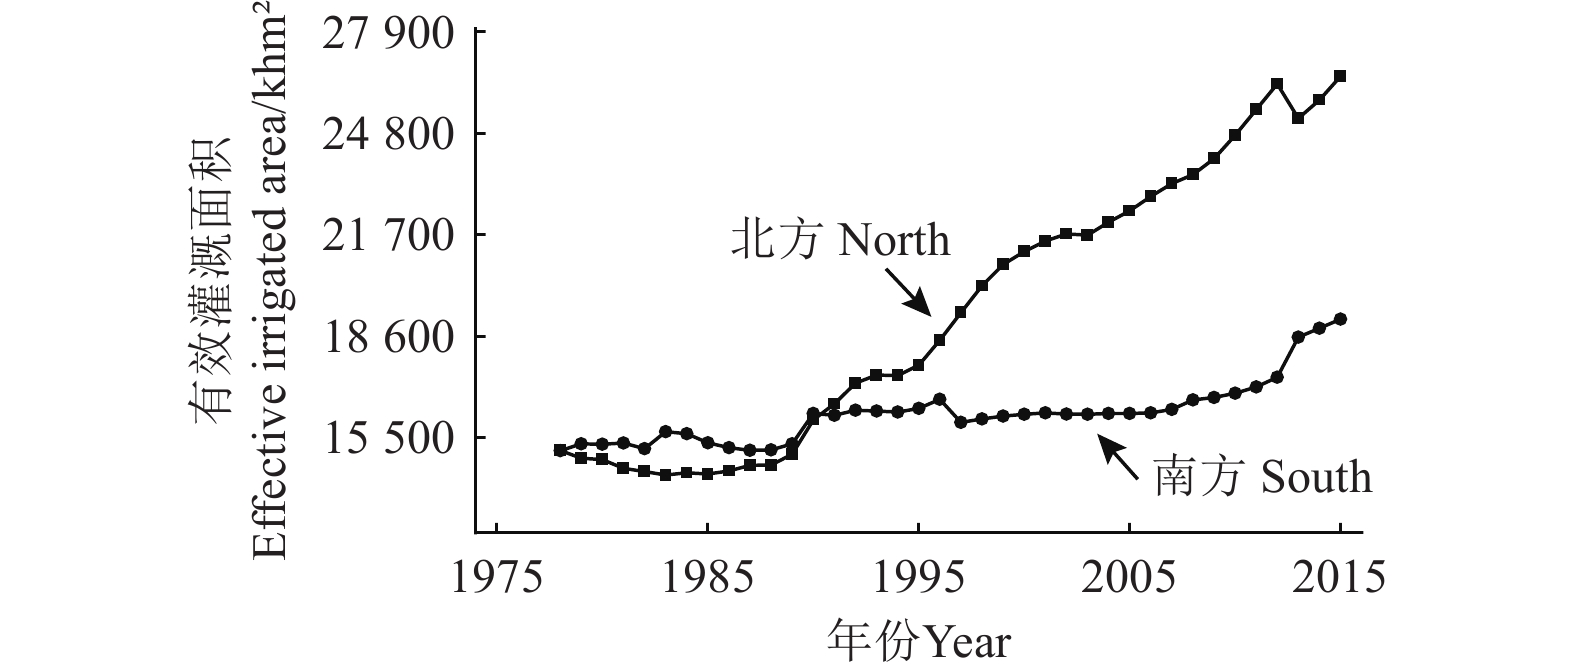
7809342 )。该数据集的空间分辨率为0.0833 °,其中1900—1980年的数据以10 a为间隔,1981—2015年的数据以5 a为间隔,本研究通过线性插值方法将1970—2015年的灌溉面积数据处理为年数据进行统计分析,为了验证灌溉面积数据的可靠性,本文将经过统计汇总后的灌溉面积数据与《中国农业统计资料1949—2019》[30]中全国历年有效灌溉数据进行了对比,2套数据的变化趋势和幅度较为吻合(图1),平均相对误差为9.9%。因此可用于中国区域灌溉面积变化对陆气耦合强度影响的分析。图2展示了南方和北方中国粮食主产区1978—2015年的灌溉面积变化,从图上可以看出1978—2015年南方和北方中国粮食主产区灌溉面积均呈现扩张趋势,且北方粮食主产区扩张速度高于南方。![]() 图 1 本研究使用数据与统计年鉴数据对比Figure 1. Comparison between data in this study and statistical yearbook data
图 1 本研究使用数据与统计年鉴数据对比Figure 1. Comparison between data in this study and statistical yearbook data![]() 图 2 粮食主产区南北方有效灌溉面积历年变化Figure 2. Annual change of effective irrigated area in the grain production areas of north and south of China
图 2 粮食主产区南北方有效灌溉面积历年变化Figure 2. Annual change of effective irrigated area in the grain production areas of north and south of China1.3 方 法
1.3.1 陆气耦合强度指标
选取GUO等[31]于2006年提出的TLMC公式来衡量陆气耦合强度的变化,公式考虑了土壤湿度和潜热通量的变化,可直观反映灌溉对陆气耦合强度的影响,计算式如下:
ICSI=∂Llh∂Ssmσ(Ssm)=COV(Ssm,Llh)σ(Ssm) 式中ICSI为陆气耦合强度指数,Ssm为土壤湿度,m3/m3,Llh为地表潜热通量,MJ/m2,Ssm与Llh进行了去趋势处理,∂Llh表示地表潜热通量的变化,∂Ssm为土壤湿度的变化,σ(Ssm)为土壤湿度的标准差,COV(Ssm,Llh)为土壤湿度与地表潜热通量的协方差。灌溉主要通过增加土壤湿度来提升下垫面潜热通量以实现其冷温效应, ICSI恰能反映两者变化协同性。当 ICSI为正值,表示此时段内区域下垫面处于土壤水分亏缺状态,土壤湿度变化对潜热通量有一定影响,即灌溉具有一定的冷温效应;当 ICSI为负值,表示当地土壤湿度足够大,且其变化并不会影响局地气候。 ICSI的物理意义是土壤湿度每变化一个标准差时潜热通量的响应值[32],表征了土壤湿度变化对潜热通量的影响。
1.3.2 密集灌溉区域与参考灌溉区域划分
采用AEI数据计算出历年每个格点的灌溉面积占比,将灌溉面积占比(current irrigated fraction, CIF)划分为多个区间,通过统计不同CIF区间的陆气耦合强度变化的差异,选择陆气耦合强度差异最明显的阙值作为密集灌溉区域和参考灌溉区域。
1.3.3 灌溉影响评估方法
BONFILS等[33]提出一种用来检测灌溉对温度的影响的方法,该方法的核心是构建密集灌溉区域和参考灌溉区域的温度时间序列变化,两者的差异为灌溉的影响。本研究采用相同的方法,即密集灌溉区域和参考灌溉区域陆气耦合强度变化趋势的差异主要由灌溉活动导致,计算式如下:
ΔICSI=ICSIirr−ICSIirrref 式中ΔICSI为密集灌溉区和参考灌溉区陆气耦合强度差值,下标irr表示密集灌溉区,irrref表示参考灌溉区。
1.3.4 突变点检验
突变分析旨在检验时间序列中是否存在显著的突变点。Pettitt检验、Buishand检验和SNHT检验是农业气象领域常用的突变检验法,3种突变检验方法的公式及统计检验的临界值详见ILORI等[34]的文献。
2. 结果与分析
2.1 密集灌溉与参考灌溉区域划分结果
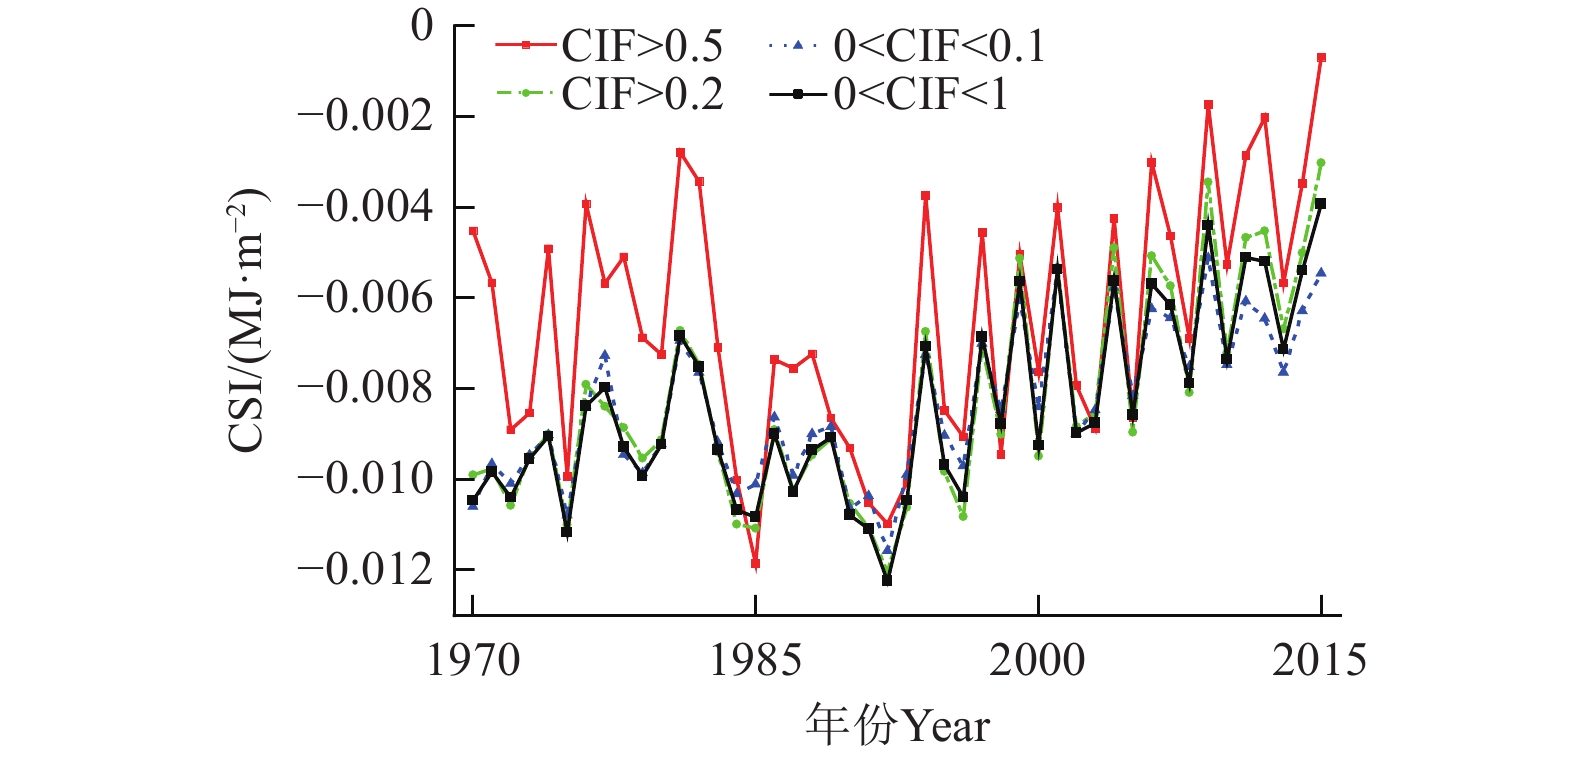
根据密集灌溉区域与参考灌溉区域划分方法,将灌溉面积占比划分为(0, 0.1)、(0.2, 1)、(0.5, 1)3个区间。图3为1970—2015年全国粮食主产区CSI变化的时间序列。CIF>0.2和0<CIF<0.1的时间序列变化相接近,CIF>0.5与0<CIF<0.1之间的差异要明显大于CIF>0.2和0<CIF<0.1的差异,经过计算对比CIF>0.5(CIF>0.2)的区域均值在46 a的序列中有40(23)a大于0<CIF<0.1的区域,CIF>0.5的区域有43 a大于CIF>0.2的区域,CIF>0.5与CIF>0.2和0<CIF<0.1的历年差值均值分别为
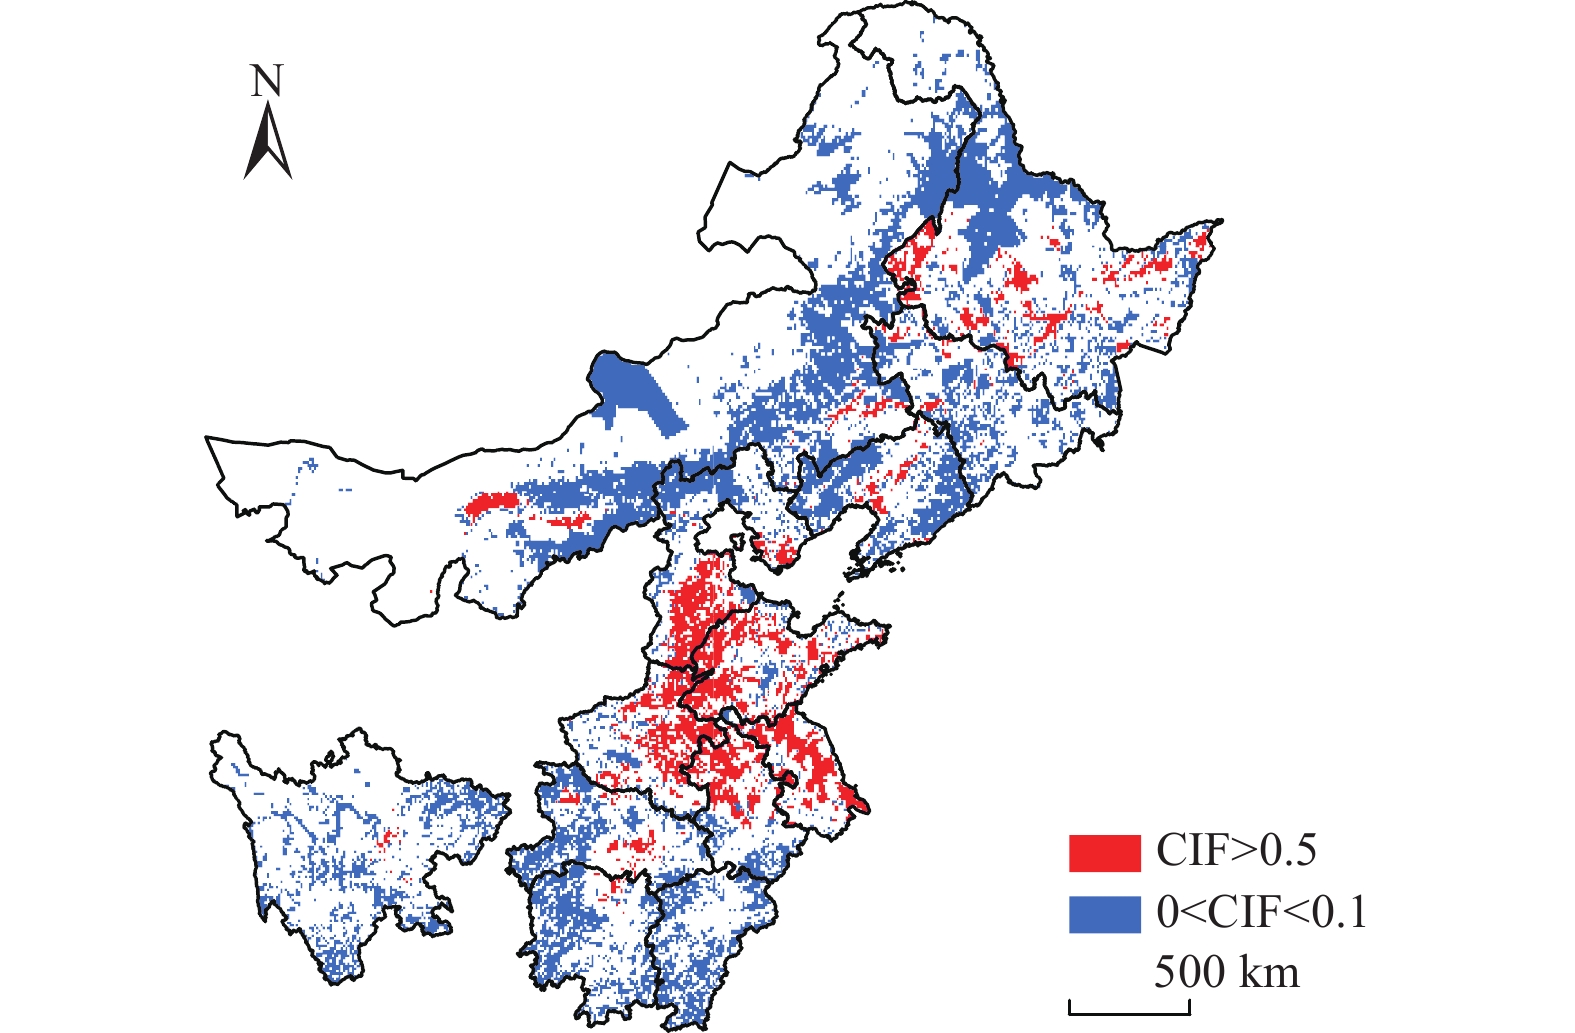
0.0018 和0.0019 MJ/m2。由此可以看出灌溉占比越大CSI越大,灌溉占比差距越大,CSI差距越大。这一结果表明灌溉对CSI的变化有影响,大规模灌溉扩张可能改变了区域的气候条件。因此本文采用CIF>0.5的区域作为密集灌溉区,记作irr;0<CIF<0.1的区域作为参考灌溉区,记作irrref。图4展示了2015年灌溉农田区和参考灌溉区的划分图,可以看出密集灌溉区主要集中在三江平原、松嫩平原、华北平原、河套平原,长江中下游等地。![]() 图 3 不同灌溉占比陆气耦合强度对比图注:CIF为灌溉面积占比。Figure 3. The difference of coupling strength index (CSI) in different CIFNote: CIF means current irrigated fraction.
图 3 不同灌溉占比陆气耦合强度对比图注:CIF为灌溉面积占比。Figure 3. The difference of coupling strength index (CSI) in different CIFNote: CIF means current irrigated fraction.![]() 图 4 2015年密集灌溉与参考灌溉区域划分Figure 4. Division of intensive irrigation and reference irrigation area in 2015
图 4 2015年密集灌溉与参考灌溉区域划分Figure 4. Division of intensive irrigation and reference irrigation area in 2015根据Pettitt检验、Buishand检验和SNHT检验结果,均显示CSI在1996年发生突变(图3),因此,本研究以1996年为转折点对南方和北方粮食主产区CSI转折前后趋势进行分析。
2.2 灌溉对南北方陆气耦合强度变化的影响
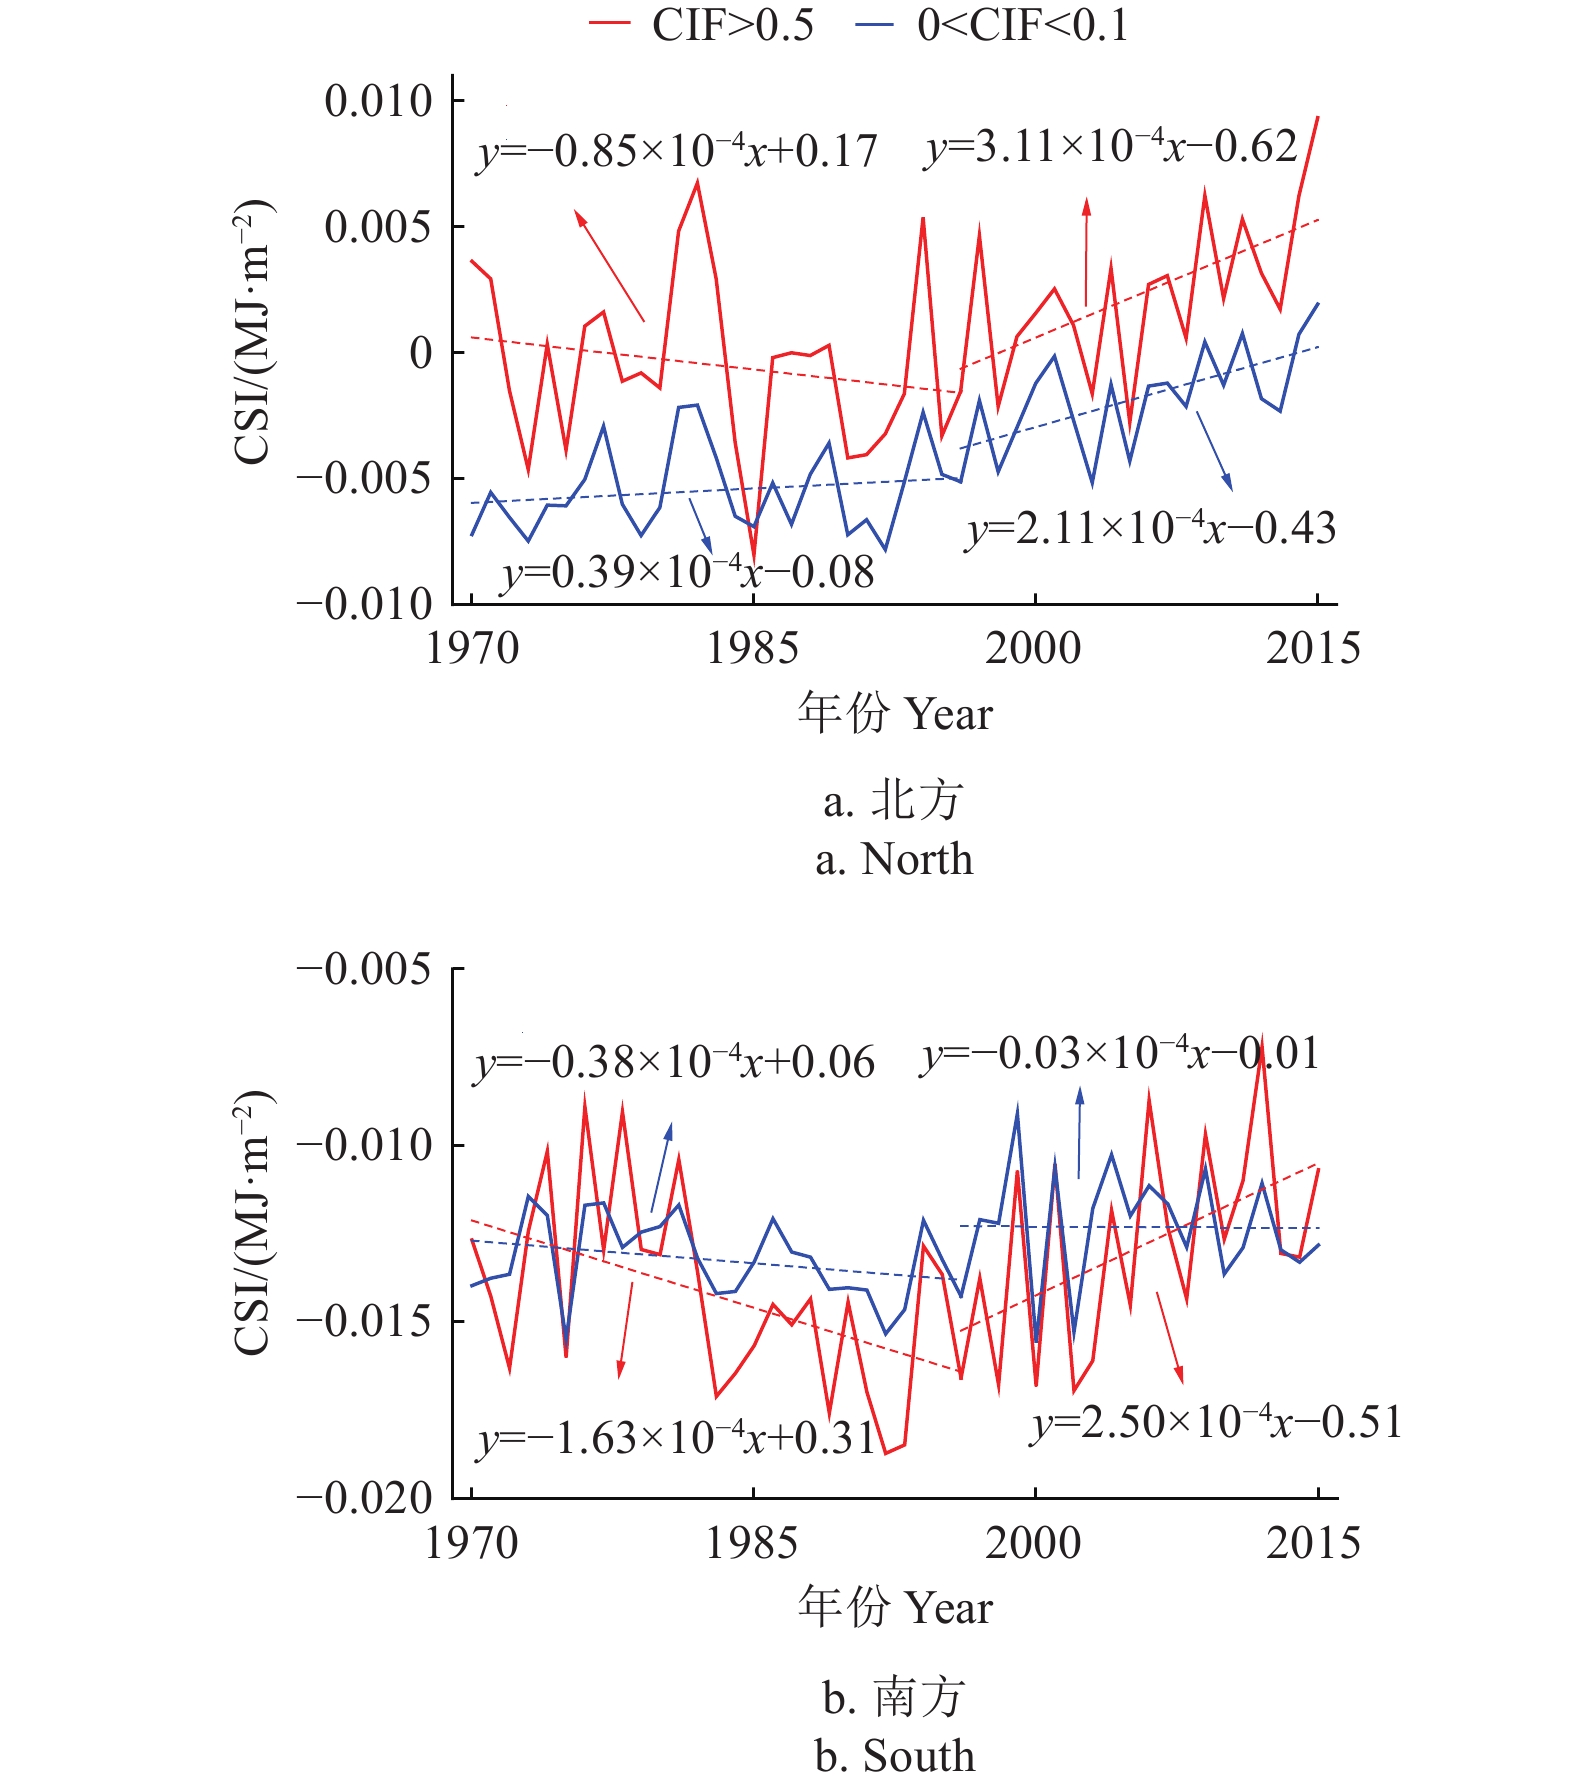
图5为1970—2015年南、北方粮食主产区密集灌溉区和参考灌溉区CSI变化,由图5可以看出南北方CSI存在差异,北方历年CSI值处于−0.008~0.009 MJ/m2之间,南方处于−
0.019 ~−0.007 MJ/m2之间。北方历年CSI要强于南方,北方CSI在正值和负值都有分布,而南方CSI则全部处于负值区域。这主要是由于北方地区多为“土壤湿度限制型”,土壤湿度影响蒸散发,土壤湿度增大,蒸发增大;南方地区为“辐射限制型”,蒸散发主要受能量限制,土壤湿度增大,蒸散发不再增大,此时蒸散发反过来影响土壤湿度[22]。![]() 图 5 1970—2015年南北方密集灌溉与参考灌溉区域CSI变化趋势Figure 5. Trend in the change in CSI between intensive irrigation areas and reference irrigation areas in the north and south from 1970 to 2015
图 5 1970—2015年南北方密集灌溉与参考灌溉区域CSI变化趋势Figure 5. Trend in the change in CSI between intensive irrigation areas and reference irrigation areas in the north and south from 1970 to 2015由图5可以看出,密集灌溉区(CIF>0.5)与参考灌溉区(0<CIF<0.1)CSI存在明显差异。对于北方粮食主产区,密集灌溉区CSI大于参考灌溉区CSI,说明大规模灌溉增强了北方的CSI。南方地区多数年份的密集灌区CSI低于参考灌区CSI,且南方地区CSI大多数年份为负值,说明陆面对大气影响作用不明显,1996年后密集灌区CSI增速远高于参考灌区CSI降低速度,所以1996年后灌溉同样增强了南方CSI,这是因为1996年前后是东亚气候显著的转折点,东部季风雨带的向北移动,导致长江流域降水偏少而长江以北地区降水增多,南方土壤湿度降低,由“辐射限制型”向“土壤湿度限制型”转换[35]。
对于密集灌溉区,1970—1995年南方和北方粮食主产区CSI分别以−0.85×10⁻⁴和−1.63×10⁻⁴ MJ/m2的速度逐年降低,而1996—2015年分别以3.11×10−4和2.50×10−4 MJ/m2的速度增加。在参考灌溉区,北方CSI在1996年转折点前后均为上升趋势,转折后CSI上升速度由0.39×10−4 MJ/m2增加到2.11×10−4 MJ/m2,南方地区CSI则在转折前后均为降低趋势,转折后CSI降低速度由−0.38×10−4 MJ/m2降低到−0.03×10−4 MJ/m2。根据1.3.3提出的影响评估方法,计算了1970—2015年密集灌溉区与参考灌溉区CSI的差异(△CSI),结果如图6所示,△CSI的下降趋势意味着灌溉对陆气耦合的增强作用的降低,上升趋势表示灌溉对陆气耦合的增强作用的提高。
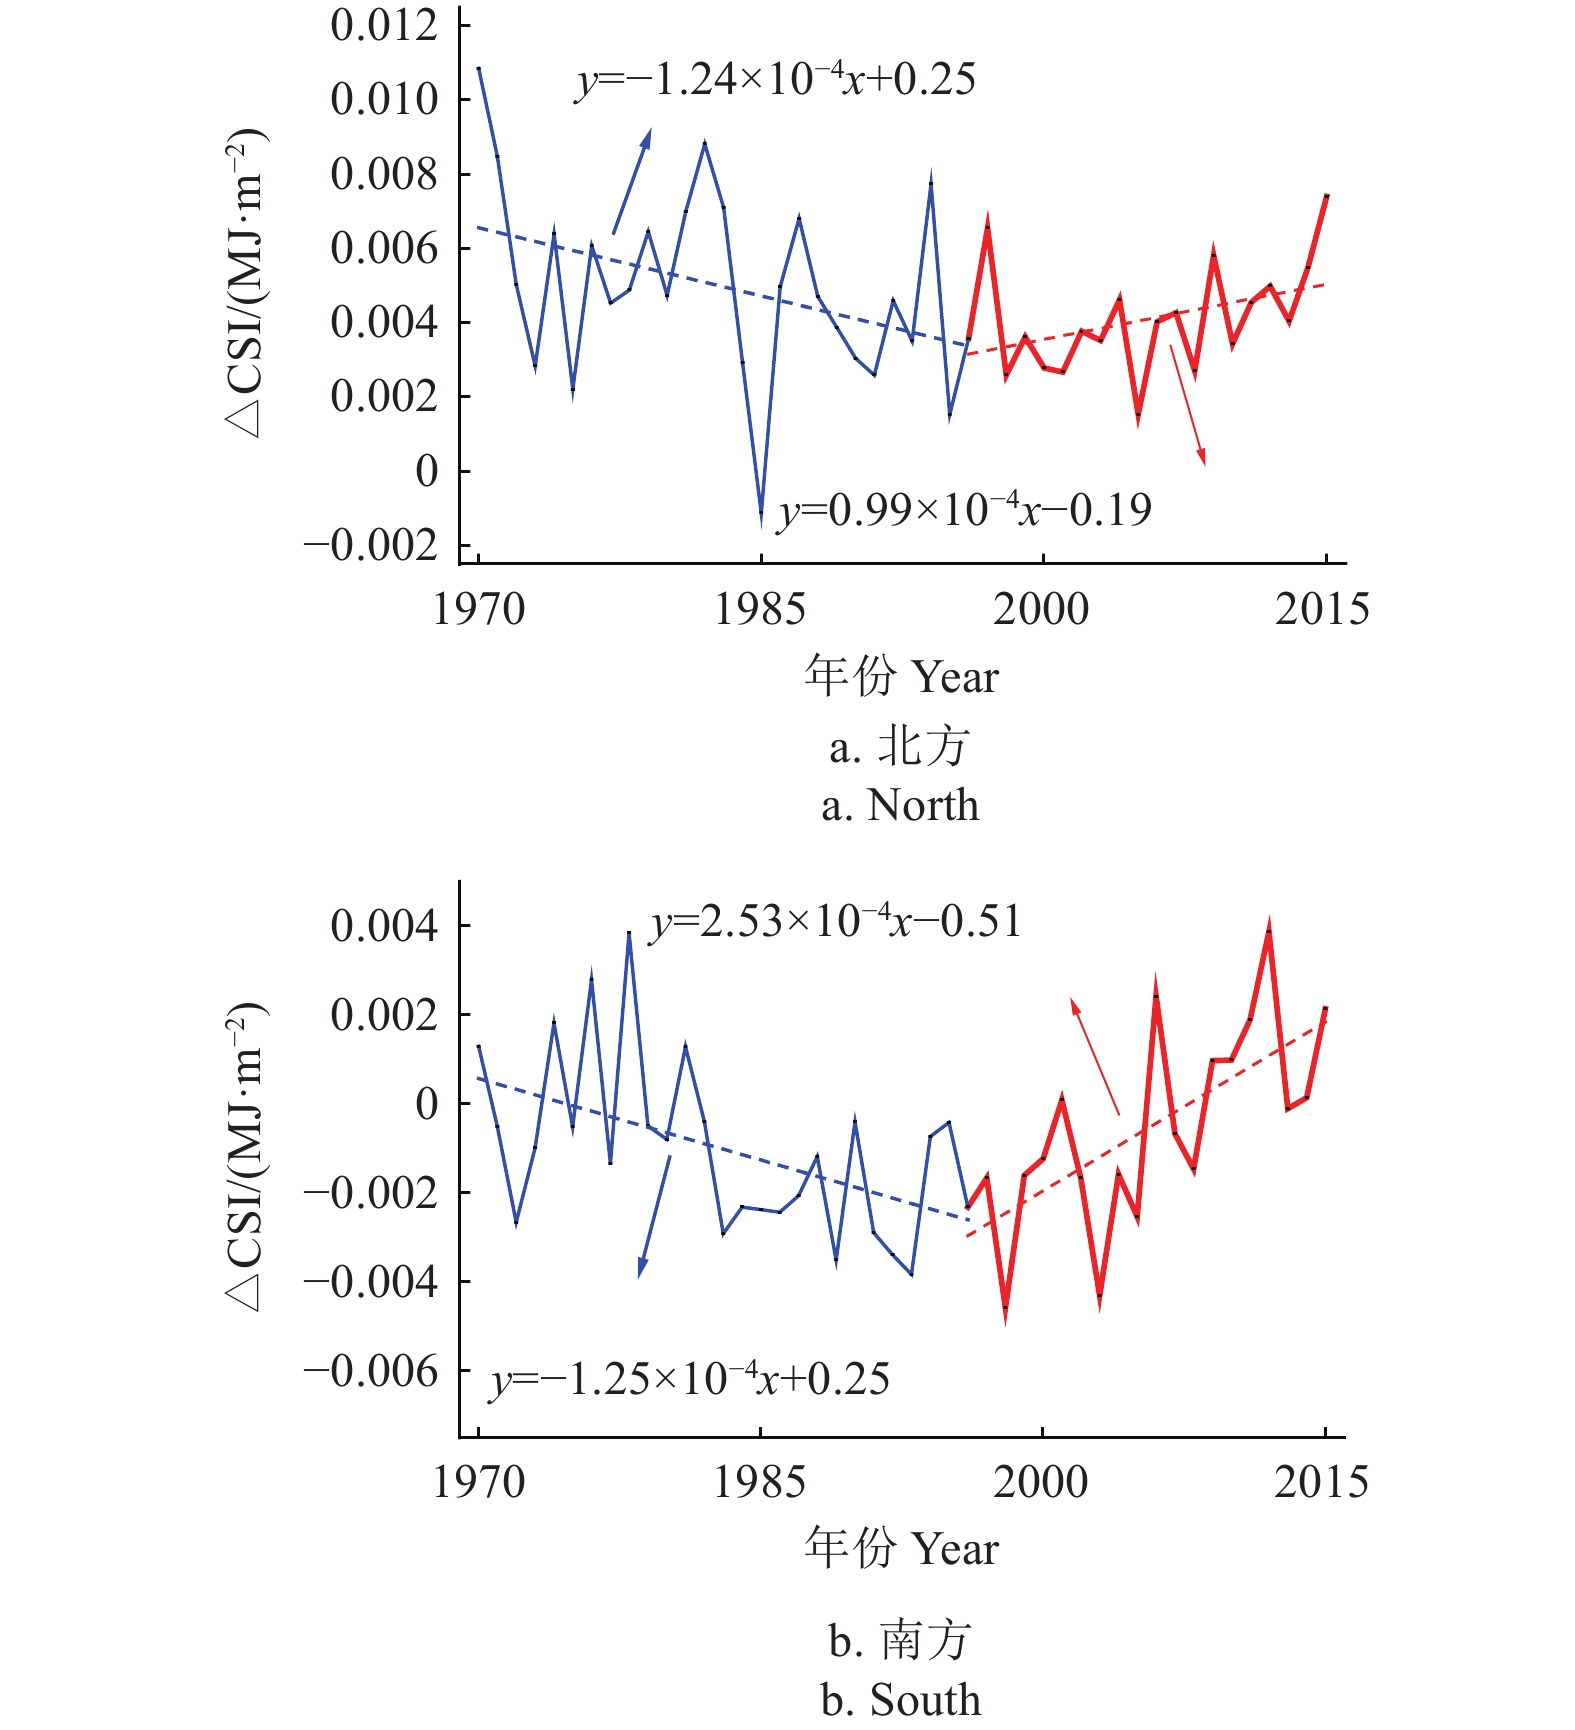
![]() 图 6 1970—2015年北方和南方密集灌溉与参考灌溉区CSI差值变化Figure 6. Change in the difference in CSI (△CSI) between intensive irrigation areas and reference irrigation areas in the north and south from 1970 to 2015
图 6 1970—2015年北方和南方密集灌溉与参考灌溉区CSI差值变化Figure 6. Change in the difference in CSI (△CSI) between intensive irrigation areas and reference irrigation areas in the north and south from 1970 to 2015对于北方和南方,△CSI在1970—1995年分别以−1.24×10⁻⁴和−1.25×10⁻⁴ MJ/m2的速率降低,在1996—2015年△CSI则分别以0.99×10−4和2.53×10−4 MJ/m2的速率上升,这表明近年来灌溉对中国粮食主产区CSI的增强作用有所提高,而1996年后南北方△CSI的主要差异是因为南方参考灌溉区1996—2015年CSI为下降趋势,北方为上升趋势,二者相反的变化趋势导致1996年后南方△CSI趋势大于北方。
2.3 灌溉影响南北方陆气耦合强度变化的机制分析
CSI主要受土壤湿度和潜热通量的协同影响,南北粮食主产区土壤湿度和潜热通量的空间分布和历年趋势如图7和图8所示。
![]() 图 7 1970—1995和1996—2015年中国粮食主产区耦合强度、土壤湿度、潜热通量与降水量空间分布注:黑点为CIF>0.5区域;SM为土壤湿度;PR为降水;LH为潜热通量;CSI为耦合强度;差值指1996—2015年与1970—1995年均值的差值。Figure 7. Spatial distribution of coupling strength, soil moisture, latent heat flux, and precipitation in China's major grain-producing areas during the periods 1970-1995 and 1996-2015Note: Black dots indicate areas where the CIF>0.5; SM is soil moisture; PR is precipitation; LH is latent heat flux; CSI is the coupling strength index; DF is the difference between the 1996-2015 and 1970-1995 averages.
图 7 1970—1995和1996—2015年中国粮食主产区耦合强度、土壤湿度、潜热通量与降水量空间分布注:黑点为CIF>0.5区域;SM为土壤湿度;PR为降水;LH为潜热通量;CSI为耦合强度;差值指1996—2015年与1970—1995年均值的差值。Figure 7. Spatial distribution of coupling strength, soil moisture, latent heat flux, and precipitation in China's major grain-producing areas during the periods 1970-1995 and 1996-2015Note: Black dots indicate areas where the CIF>0.5; SM is soil moisture; PR is precipitation; LH is latent heat flux; CSI is the coupling strength index; DF is the difference between the 1996-2015 and 1970-1995 averages.![]() 图 8 1970—2015年北方、南方密集灌溉与参考灌溉区域土壤湿度与潜热通量变化趋势Figure 8. Trend in soil moisture and latent heat flux changes between intensive irrigation areas and reference irrigation areas in the north and south from 1970 to 2015
图 8 1970—2015年北方、南方密集灌溉与参考灌溉区域土壤湿度与潜热通量变化趋势Figure 8. Trend in soil moisture and latent heat flux changes between intensive irrigation areas and reference irrigation areas in the north and south from 1970 to 2015图7为CSI、SM、LH和降水量的空间分布,黑点表示密集灌溉区。1996—2015年内蒙古东北部相比1970—1995年变化幅度较大,导致北方参考灌溉区△CSI增大(图7a和图7b),而南方参考灌溉区△CSI与北方相比变化较小(图7i)。北方和南方粮食主产区土壤湿度、潜热通量的历年变化趋势如图8所示,可以看出,北方密集灌溉区和参考灌溉区土壤湿度和潜热通量在1996年后都呈现为明显的下降趋势,而南方粮食主产区在1996年后密集灌溉区土壤湿度为上升趋势,密集灌溉区潜热通量为下降趋势;参考灌溉区土壤湿度为下降趋势,参考灌溉区潜热通量为上升趋势,土壤湿度和潜热通量的相反趋势变化导致南方密集灌区和参考灌溉区的△CSI变大(图7i)。从图8b也可以看出,南方密集灌区和参考灌溉区的土壤湿度整体降低,与前文提到的长江流域降水偏少相符合。
北方和南方密集灌溉区土壤湿度小于参考灌溉区土壤湿度(图8a,图8b),这是因为北方密集灌区主要位于华北平原和河套平原,由图7c、图7d可以看出,华北平原密集灌溉区土壤湿度处于0.20~0.25 m3/m3、河套平原地区密集灌溉区土壤湿度处于0.15~0.20 m3/m3,均低于参考灌溉区土壤湿度的0.25~0.45 m3/m3。南方密集灌区主要位于长江中下游平原,此地区密集灌溉区土壤湿度处于0.25~0.30 m3/m3要低于更南方的参考灌溉区土壤湿度的0.30~0.45 m3/m3。
北方密集灌区潜热通量在1996年以前高于参考灌溉区潜热通量,但是在1996年以后迅速降低且低于参考灌溉区潜热通量(图7k),由图7e和图7f的空间分布可以看出此变化。华北平原1970—1995年密集灌溉区潜热通量处于30~40 MJ/m2的黄色区域,而1996—2015年则处于20~30 MJ/m2的浅蓝色区域,自1996年后密集灌溉区潜热通量降低明显。1996年转折后由图7k可以看出大部分区域潜热通量降低了0~6 MJ/m2,最高降幅约15%。1996年后,华北平原密集灌溉区潜热通量由1996年以前的黄色高值区域转为蓝色低值区域,导致1996年后北方密集灌溉区潜热通量小于参考灌溉区潜热通量。
由图7k可以看出,南方地区自1996年转折后密集灌溉区潜热通量有增有减,约0~3 MJ/m2,而参考灌溉区潜热通量则增加明显,整体在0~4 MJ/m2。1970—1995年密集灌溉区潜热通量呈递增趋势,参考灌溉区潜热通量为递减趋势,1996年转折后,趋势则完全相反,密集灌溉区潜热通量逐年递减,参考灌溉区潜热通量逐年增大(图8d),在转折后的这种趋势下参考灌溉区潜热通量会超过密集灌溉区潜热通量(图7f)。1970—1995年密集灌溉区潜热通量和参考灌溉区潜热通量多处于40~50 MJ/m2,仅东南部小部分地区处于50~60 MJ/m2,而1996—2015年参考灌溉区潜热通量处于50~60 MJ/m2的区域明显增多,密集灌溉区潜热通量则依旧多处于40~50 MJ/m2。
由图7和图8可以看出,1996年转折后中国南北方的土壤湿度普遍降低,降水的空间变化趋势与土壤湿度变化相一致,表明中国南方和北方地区普遍正在变得更加干旱,这与马柱国等[36]的研究结果相符。在北方地区蒸发主要受土壤湿度控制,当土壤湿度增加(减少)时,蒸散发增加(减少),两者变化一致导致CSI值高,由图8a、图8c可以看出北方地区整体符合这种“土壤湿度限制型”的反馈机制,由图7j、图7k可以看出处于湿润和半湿润地区的东北地区,出现了土壤湿度减少,蒸散发增加的现象,表现出“能量限制型”,由于当地土壤湿度足够充分,导致实际蒸散发量接近潜在蒸散发量,当地表接受更多地净辐射时,蒸散发增加,土壤湿度减少。同样的南方地区蒸散发与土壤湿度的变化趋势并不趋同,也是典型的“能量限制型”[37]。
3. 讨 论
本文研究结果表明1996年前后东亚气候发生了显著转折,导致降水和土壤湿度的变化趋势发生了转折,使得南方粮食主产区土壤湿度降低,由“辐射限制型”向“土壤湿度限制型”转换,导致灌溉对南方粮食主产区CSI的增强作用有所提高。LIU等[38]同样发现了华北平原灌溉的降温效应在1995年后发生突变,灌溉的降温效应减弱,并将此结果归因于自20世纪90年代以来节水灌溉的发展导致灌溉水量的下降从而改变地表能量平衡使得降温效应减弱。20世纪90年代以前,节水灌溉水平不高,此时的灌溉方式多为畦灌,随着灌溉面积增大单位面积灌溉水量也在不断上升[39]。这种灌溉方式灌溉用水量较大,大幅增加了土壤含水量,有效降低了农田温度,所以随着灌溉面积的增加农田整体降温效应有所增强。随着20世纪90年代节水灌溉大面积普及,单位面积灌溉水量不断降低,灌溉降温效应减弱。这里需要指出的是本文在探讨灌溉对CSI的影响时只考虑了灌溉面积扩张的影响,从图2中可以看出南北粮食主产区灌溉面积均显扩张趋势,在20世纪90年代末并未出现明显的停滞,节水灌溉的作用并不显著,在土壤湿度的降低趋势中,气候转折和节水灌溉的占比仍需进一步研究。
4. 结 论
本文分析了1970—2015年灌溉对粮食主产区陆气耦合强度的影响,结果表明:
1)中国粮食主产区陆气耦合强度(coupling strength index,CSI)受到大规模灌溉的影响,密集灌溉区的CSI显著大于参考灌溉区,灌溉增强了CSI,且近年来这种增强效应正在逐渐变大,使得中国向更加干旱的趋势发展。
2)总体上北方粮食主产区CSI强于南方粮食主产区,1996年后,北方和南方密集灌溉区CSI变化趋势相同,但北方参考灌溉区CSI变化趋势高于南方,导致北方密集灌溉区与参考灌溉区陆气耦合强度的差值降低,南方显著升高。
3)1996年前后东亚气候发生了显著转折,导致降水和土壤湿度的变化趋势发生了转折,使得南方粮食主产区土壤湿度降低,由“辐射限制型”向“土壤湿度限制型”转换,导致灌溉对南方粮食主产区CSI的增强作用有所提高。
-
![]()
图 1 本研究使用数据与统计年鉴数据对比
Figure 1. Comparison between data in this study and statistical yearbook data
![]()
图 2 粮食主产区南北方有效灌溉面积历年变化
Figure 2. Annual change of effective irrigated area in the grain production areas of north and south of China
![]()
图 3 不同灌溉占比陆气耦合强度对比图
注:CIF为灌溉面积占比。
Figure 3. The difference of coupling strength index (CSI) in different CIF
Note: CIF means current irrigated fraction.
![]()
图 4 2015年密集灌溉与参考灌溉区域划分
Figure 4. Division of intensive irrigation and reference irrigation area in 2015
![]()
图 5 1970—2015年南北方密集灌溉与参考灌溉区域CSI变化趋势
Figure 5. Trend in the change in CSI between intensive irrigation areas and reference irrigation areas in the north and south from 1970 to 2015
![]()
图 6 1970—2015年北方和南方密集灌溉与参考灌溉区CSI差值变化
Figure 6. Change in the difference in CSI (△CSI) between intensive irrigation areas and reference irrigation areas in the north and south from 1970 to 2015
![]()
图 7 1970—1995和1996—2015年中国粮食主产区耦合强度、土壤湿度、潜热通量与降水量空间分布
注:黑点为CIF>0.5区域;SM为土壤湿度;PR为降水;LH为潜热通量;CSI为耦合强度;差值指1996—2015年与1970—1995年均值的差值。
Figure 7. Spatial distribution of coupling strength, soil moisture, latent heat flux, and precipitation in China's major grain-producing areas during the periods 1970-1995 and 1996-2015
Note: Black dots indicate areas where the CIF>0.5; SM is soil moisture; PR is precipitation; LH is latent heat flux; CSI is the coupling strength index; DF is the difference between the 1996-2015 and 1970-1995 averages.
-
[1] 杜世雄,吴瑞英,孙怀卫,等. 中巴经济走廊极端降水事件分析[J]. 农业工程学报,2022,38(增刊1):152-160. DU Shixiong, WU Ruiying, SUN Huaiwei, et al. Analysis of extreme precipitation events along the China-Pakistan Economic Corridor[J]. Transactions of the Chinese Society of Agricultural Engineering (Transactions of the CSAE), 2022, 38(Supp.1): 152-160. (in Chinese with English abstract)
[2] ZHAO X, LI H, CAI Q, et al. Managing extreme rainfall and flooding events: A case study of the 20 July 2021 Zhengzhou flood in China[J]. Climate, 2023, 11(11): 228. doi: 10.3390/cli11110228
[3] 许吟隆,赵明月,李阔,等. 农业适应气候变化研究进展回顾与展望[J]. 中国生态农业学报(中英文),2023,31(8):1155-1170. XU Yinlong, ZHAO Mingyue, LI Kuo, et al. Review on the research progress of agricultural adaptation to climate change and perspectives[J]. Chinese Journal of Eco-Agriculture, 2023, 31(8): 1155-1170. (in Chinese with English abstract)
[4] 谭丽丽,冯璞玉,刘德立,等. 气候变化条件下海河平原作物灌溉策略优化模拟[J]. 农业工程学报,2024,40(16):84-93. doi: 10.11975/j.issn.1002-6819.202312189 TAN Lili, FENG Puyu, LIU Deli, et al. Optimization of crop irrigation strategies using modeling in Haihe Plain under climate change[J]. Transactions of the Chinese Society of Agricultural Engineering (Transactions of the CSAE), 2024, 40(16): 84-93. (in Chinese with English abstract) doi: 10.11975/j.issn.1002-6819.202312189
[5] 高芸,胡铁松,袁宏伟,等. 淮北平原旱涝急转条件下水稻减产规律分析[J]. 农业工程学报,2017,33(21):128-136. doi: 10.11975/j.issn.1002-6819.2017.21.015 GAO Yun, HU Tiesong, YUAN Hongwei, et al. Analysis on yield reduced law of rice in Huaibei plain under drought-flood abrupt alternation[J]. Transactions of the Chinese Society of Agricultural Engineering (Transactions of the CSAE), 2017, 33(21): 128-136. (in Chinese with English abstract) doi: 10.11975/j.issn.1002-6819.2017.21.015
[6] 翟盘茂,周佰铨,陈阳,等. 气候变化科学方面的几个最新认知[J]. 气候变化研究进展,2021,17(6):629-635. ZHAI Panmao, ZHOU Baiquan, CHEN Yang, et al. Several new understandings in the climate change science[J]. Climate Change Research, 2021, 17(6): 629-635(in Chinese with English abstract)
[7] 李耀辉,孟宪红,张宏升,等. 青藏高原—沙漠的陆—气耦合及对干旱影响的进展及其关键科学问题[J]. 地球科学进展,2021,36(3):265-275. doi: 10.11867/j.issn.1001-8166.2021.029 LI Yaohui, MENG Xianhong, ZHANG Hongsheng, et al. Advances and key scientific issues of land-atmosphere coupling between the Tibet Plateau and the northern desert and its impact on Northern China drought[J]. Advances in Earth Science, 2021, 36(3): 265-275. (in Chinese with English abstract) doi: 10.11867/j.issn.1001-8166.2021.029
[8] BELLUCCI A, HAARSMA R, BELLOUIN N, et al. Advancements in decadal climate predictability: The role of nonoceanic drivers[J]. Reviews of Geophysics, 2015, 53(2): 165-202. doi: 10.1002/2014RG000473
[9] 史锐光,刘懿,袁飞,等. 多时间尺度下中国区域土壤湿度记忆性时空特征及趋势分析[J]. 农业工程学报,2023,39(9):123-130. SHI Ruiguang, LIU Yi, YUAN Fei, et al. Spatio-temporal characteristics and trend analysis of soil moisture memory at multiple time scales in China[J]. Transactions of the Chinese Society of Agricultural Engineering (Transactions of the CSAE), 2023, 39(9): 123-130. (in Chinese with English abstract)
[10] 束士杰,刘朝顺,施润和,等. 基于集合卡尔曼滤波的地表水热通量同化研究[J]. 农业工程学报,2013,29(6):82-90. SHU Shijie, LIU Chaoshun, SHI Runhe, et al. Assimilation of surface water heat flux using ensemble kalman filter[J]. Transactions of the Chinese Society of Agricultural Engineering (Transactions of the CSAE), 2013, 29(6): 82-90. (in Chinese with English abstract)
[11] LOBELL D B, DEINES J M, TOMMASO S D. Changes in the drought sensitivity of US maize yields[J]. Nature Food, 2020, 1(11): 729-735. doi: 10.1038/s43016-020-00165-w
[12] 刘艺朦,魏江峰,赵景文. WRF4.0模式陆气耦合对不同物理参数化方案的敏感性初探[J]. 大气科学学报,2023,46(3):431-440. LIU Yimeng, WEI Jiangfeng, ZHAO Jingwen. A preliminary study on the sensitivity of WRF 4.0 model land-atmosphere coupling to different physical parameterization schemes[J]. Transactions Atmospheric Sciences, 2023, 46(3): 431-440. (in Chinese with English abstract)
[13] 魏江峰,宋媛媛,逯博延. 华北降水日循环与陆气耦合和气溶胶联系的研究进展[J]. 地球科学进展,2023,38(9):881-889. doi: 10.11867/j.issn.1001-8166.2023.055 WEI Jiangfeng, SONG Yuanyuan, LU Boyan. Research advances in the diurnal cycle of precipitation in north China and its relationship with land-atmosphere coupling and aerosols[J]. Advances in Earth Science, 2023, 38(9): 881-889. (in Chinese with English abstract) doi: 10.11867/j.issn.1001-8166.2023.055
[14] WEI J, DIRMEYER P A, WISSER D, et al. Where does the irrigation water go? An estimate of the contribution of irrigation to precipitation using MERRA[J]. Journal of Hydrometeorology, 2013, 14(1): 275-289. doi: 10.1175/JHM-D-12-079.1
[15] LAWSTON-PARKER P, SANTANELLO JR J A, CHANEY N W. Investigating the response of land–atmosphere interactions and feedbacks to spatial representation of irrigation in a coupled modeling framework[J]. Hydrology and Earth System Sciences, 2023, 27(14): 2787-2805. doi: 10.5194/hess-27-2787-2023
[16] ASMUS C, HOFFMANN P, PIETIKÄINEN J P, et al. Modeling and evaluating the effects of irrigation on land–atmosphere interaction in southwestern Europe with the regional climate model REMO2020–iMOVE using a newly developed parameterization[J]. Geoscientific Model Development, 2023, 16(24): 7311-7337. doi: 10.5194/gmd-16-7311-2023
[17] CHOU C, RYU D, LO M H, et al. Irrigation-Induced Land–Atmosphere Feedbacks and Their Impacts on Indian Summer Monsoon[J]. Journal of Climate, 2018, 31(21): 8785-8801. doi: 10.1175/JCLI-D-17-0762.1
[18] LU Y, HARDING K, KUEPPERS L. Irrigation effects on land–atmosphere coupling strength in the United States[J]. Journal of Climate, 2017, 30(10): 3671-3685. doi: 10.1175/JCLI-D-15-0706.1
[19] LIU G, WANG W, SHAO Q. Recent decline of irrigation-induced cooling effect over the North China Plain in observations and model simulations[J]. Geophysical Research Letters, 2023, 50(2): e2022GL101973. doi: 10.1029/2022GL101973
[20] GARCIA-CARRERAS L, PARKER D J, MARSHAM J H. What is the mechanism for the modification of convective cloud distributions by land surface–induced flows?[J]. Journal of the Atmospheric Sciences, 2011, 68(3): 619-634. doi: 10.1175/2010JAS3604.1
[21] BADGER A M, DIRMEYER P A. Climate response to Amazon forest replacement by heterogeneous crop cover[J]. Hydrology and Earth System Sciences, 2015, 19(11): 4547-4557. doi: 10.5194/hess-19-4547-2015
[22] 杨扬,杨启东,王芝兰,等 中国区域陆气耦合强度的时空分布特征[J]. 干旱气象,2021,39(3):374-385. YANG Yang, YANG Qidong, WANG Zhilan, et al. A study of spatial and temporal distribution of land atmosphere coupling strength in China[J]. Journal of Arid Meteorology, 2021, 39(3): 374-385 (in Chinese with English abstract)
[23] 杨洋,林朝晖,骆利峰. 中国区域夏季地表气温与陆面过程耦合强度的分布特征[J]. 气候与环境研究,2022,27(3):333-350. YANG Yang, LIN Zhaohui, LUO Lifeng. Spatial characteristics of surface air temperature–land surface coupling strength during summer in China[J]. Climatic and Environmental Research, 2022, 27(3): 333-350. (in Chinese with English abstract)
[24] REZAEI E E, WEBBER H, ASSENG S, et al. Climate change impacts on crop yields[J]. Nature Reviews Earth & Environment, 2023, 4(12): 831-846.
[25] ZHANG C, DONG J, GE Q. Mapping 20 years of irrigated croplands in China using MODIS and statistics and existing irrigation products[J]. Scientific Data, 2022, 9(1): 407. doi: 10.1038/s41597-022-01522-z
[26] 国家统计局. 中国统计年鉴[M]. 北京:中国统计出版社,2022. [27] ZHANG L, YANG Y, LIU Y, et al. Evaluation of long time-series soil moisture products using extended triple collocation and in situ measurements in China[J]. Atmosphere, 2023, 14(9): 1351. doi: 10.3390/atmos14091351
[28] 杨扬,王丽娟,黄小燕,等. 基于ERA5-Land产品的黄河流域蒸散时空变化特征[J]. 干旱气象,2023,41(3):390-402. doi: 10.11755/j.issn.1006-7639(2023)-03-0390 YANG Yang, WANG Lijuan, HUANG Xiaoyan, et al. Analysis on spatio-temporal variation of evapotranspiration in the Yellow River Basin based on ERA5-Land products[J]. Journal of Arid Meteorology, 2023, 41(3): 390-402. (in Chinese with English abstract) doi: 10.11755/j.issn.1006-7639(2023)-03-0390
[29] MEHTA P, SIEBERT S, KUMMU M, et al. Half of twenty-first century global irrigation expansion has been in water-stressed regions[J]. Nature Water, 2024, 2(3): 254-261. doi: 10.1038/s44221-024-00206-9
[30] 国家统计局农村社会经济调查司. 中国农业统计资料(1949-2019)[M]. 第1版. 北京:中国统计出版社,2020. [31] GUO Z, DIRMEYER P A, KOSTER R D, et al. GLACE: The global land–atmosphere coupling experiment. Part ii: Analysis[J]. Journal of Hydrometeorology, 2006, 7(4): 611-625. doi: 10.1175/JHM511.1
[32] 邸燕君,曾鼎文,张文波,等. 亚洲东部和南部土壤干湿状态对陆气耦合的影响分析[J]. 干旱气象,2022,40(3):345-353. doi: 10.11755/j.issn.1006-7639(2022)-03-0345 DI Yanjun, ZENG Dingwen, ZHANG Wenbo, et al. Influence of dry/wet soil state on land-atmosphere coupling over eastern and southern Asia[J]. Journal of Arid Meteorology, 2022, 40(3): 345-353. (in Chinese with English abstract) doi: 10.11755/j.issn.1006-7639(2022)-03-0345
[33] BONFILS C, LOBELL D. Empirical evidence for a recent slowdown in irrigation-induced cooling[J]. Proceedings of the National Academy of Sciences, 2007, 104(34): 13582-13587. doi: 10.1073/pnas.0700144104
[34] ILORI O W, AJAYI V O. Change detection and trend analysis of future temperature and rainfall over west Africa[J]. Earth Systems and Environment, 2020, 4(3): 493-512. doi: 10.1007/s41748-020-00174-6
[35] 丁一汇,司东,柳艳菊,等. 论东亚夏季风的特征、驱动力与年代际变化[J]. 大气科学,2018,42(3):533-558. DING Yihui, SI Dong, LIU Yanju, et al. On the characteristics, driving forces and inter-decadal variability of the East Asian summer monsoon[J]. Chinese Journal of Atmospheric Sciences, 2018, 42(3): 533-558(in Chinese with English abstract)
[36] 马柱国,符淙斌,杨庆,等. 关于我国北方干旱化及其转折性变化[J]. 大气科学,2018,42(4):951-961. MA Zhuguo, FU Congbin, YANG Qing, et al. 2018. Drying trend in northern China and its shift during 1951–2016[J]. Chinese Journal of Atmospheric Sciences, 2018, 42(4): 951-961. (in Chinese with English abstract)
[37] 薛紫月. 中国北方地区骤发干旱的时空特征和发生机理[D]. 南京:南京信息工程大学,2024. XUE Ziyue. Spatiotemporal Characteristics and Occurrence Mechanisms of Sudden Droughts in Northern China[D]. Nanjing: Nanjing University of Information Science & Technology, 2024. (in Chinese with English abstract)
[38] LIU G, WANG W. Irrigation‐induced crop growth enhances irrigation cooling effect over the North China plain by increasing transpiration[J]. Water Resources Research, 2023, 59(3): e2022WR034142. doi: 10.1029/2022WR034142
[39] 吴普特,赵西宁. 气候变化对中国农业用水和粮食生产的影响[J]. 农业工程学报,2010,26(2):1-6. doi: 10.3969/j.issn.1002-6819.2010.02.001 WU Pute, ZHAO Xining. Impact of climate change on agricultural water use and grain production in China[J]. Transactions of the Chinese Society of Agricultural Engineering (Transactions of the CSAE), 2010, 26(2): 1-6. (in Chinese with English abstract) doi: 10.3969/j.issn.1002-6819.2010.02.001
 下载:
下载:


计量
- 文章访问数: 149
- HTML全文浏览量: 12
- PDF下载量: 52